
- Title
-
Fxr signaling and microbial metabolism of bile salts in the zebrafish intestine
- Authors
- Wen, J., Mercado, G.P., Volland, A., Doden, H.L., Lickwar, C.R., Crooks, T., Kakiyama, G., Kelly, C., Cocchiaro, J.L., Ridlon, J.M., Rawls, J.F.
- Source
- Full text @ Sci Adv
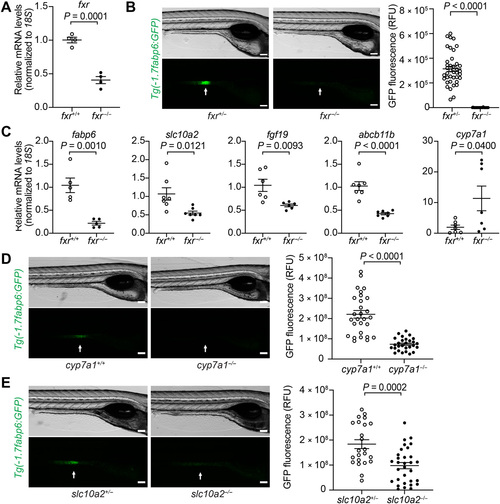
Genetic analyses reveal conserved key components of the bile salt–Fxr signaling axis in zebrafish.(A) Quantitative reverse transcription polymerase chain reaction (qRT-PCR) comparing fxr expression in whole 7-day post-fertilization (dpf) fxr wild-type (wt) (fxr+/+) or fxr homozygous mutant (fxr−/−) zebrafish larvae. (B) Imaging and quantification of GFP fluorescence of the ileal region of 7-dpf fxr+/+ and fxr−/− Tg(-1.7fabp6:GFP) larvae. The ileal region is indicated by arrows. RFU, relative fluorescence unit. (C) qRT-PCR comparing expression of genes related to bile salt metabolism in dissected digestive tracts (including intestine, liver, pancreas, and gall bladder) of 7-dpf fxr+/+ or fxr−/− larvae (for fabp6, slc10a2, and fgf19) or dissected liver of gender- and size-matched adult male fxr+/+ or fxr−/− zebrafish (for abcb11b and cyp7a1). The results are represented as relative expression levels normalized to 18S (mean ± SEM). (D and E) Imaging and quantification of GFP fluorescence of the ileal region of 7-dpf Tg(-1.7fabp6:GFP) cyp7a1+/+ and cyp7a1−/− larvae (D) or slc10a2+/− and slc10a2−/− larvae (E). The zebrafish ileal region is indicated by arrows. Scale bars, 100 μm in (B), (D), and (E). Statistical significance was calculated by unpaired t test. Representative data from at least three independent experiments are shown. |
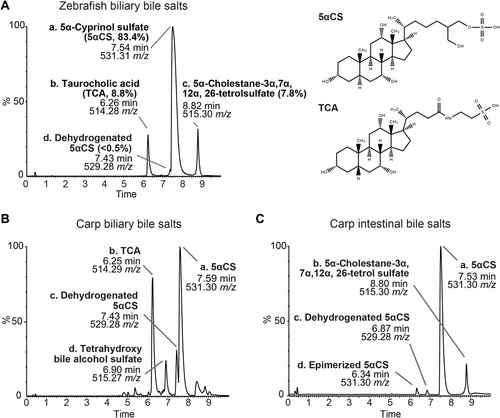
Zebrafish and carp bile salts consist of both C24 bile alcohols and C27 bile acids.(A) Mass spectrometry chromatograms of the bile salts extracted from adult zebrafish gallbladders. The identity and proportion of major peaks are listed. The height of each peak is shown as the relative percentage that was normalized to the highest peak of the metabolites detected. Structures of 5αCS and TCA are shown. (B and C) MS chromatograms of the bile salts extracted from adult carp gallbladders (B) or adult carp intestinal contents (C). The identities of major peaks are listed accordingly. |
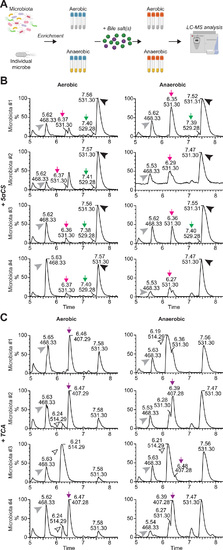
Microbiota modulate bile salt diversity in zebrafish.(A) Schematic diagram of the in vitro bile salt metabolism assay. Complex microbiota or individual bacterial strains were enriched in modified tryptic soy broth (TSB) media under both aerobic and anaerobic conditions, and then incubated with 50 μM bile salts of interest, after which the total bile salts were extracted from individual bacterial cultures and subjected to LC-MS to identify modification of the supplemented bile salts. The diagram is created with BioRender.com. (B and C) LC-MS chromatographs of bile salt metabolites extracted from enriched zebrafish microbiota cultures supplemented with 50 μM 5αCS (B) or TCA (C) under aerobic (left) or anaerobic (right) conditions. The arrowheads indicate the supplemented bile salts and internal control: black arrowhead, 5αCS; white arrowhead, TCA; gray arrowhead, internal standard D4-glycocholic acid (D4-GCA). The arrows indicate that bile salt metabolites resulted from microbial modification of the supplemented bile salts: green arrow, dehydrogenated 5αCS; magenta arrow, epimerized 5αCS; purple arrow, CA. The height of each peak is shown as the relative percentage that was normalized to the highest peak of the metabolites detected. Representative chromatographs of zebrafish microbiota from four independent biological replicate cultures are shown. |
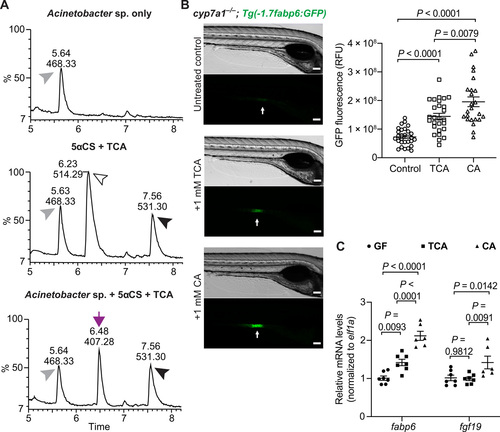
A zebrafish gut bacterium modifies primary bile acid producing a metabolite that augments Fxr signaling in zebrafish.(A) LC-MS chromatographs of medium only control (top), bile salts only control (middle), and Acinetobacter sp. ZOR0008 culture supplemented with bile salts (bottom) under aerobic conditions. The arrowheads indicate the supplemented bile salts and internal control: black arrowhead, 5αCS; white arrowhead, TCA; gray arrowhead, internal standard D4-GCA. The purple arrow indicates that the liberated CA resulted from bacterial deconjugation of TCA. Results from other bacterial strains are shown in fig. S4C. (B) Imaging and quantification of GFP fluorescence of the ileal region of 7-dpf Tg(-1.7fabp6:GFP) cyp7a1−/− larvae that were untreated or treated with either 1 mM TCA or CA for 4 days. The zebrafish ileal region is indicated by arrows. Scale bars, 100 μm. (C) qRT-PCR comparing the expression of Fxr target genes in 7-dpf wt germ-free larvae that were untreated or treated with either 1 mM TCA or CA for 4 days. The results are represented as relative expression levels normalized to the housekeeping gene ef1a (mean ± SEM). Statistical significance was calculated by one-way (B) and two-way (C) analysis of variance (ANOVA) with Tukey’s multiple comparisons test. Representative data from at least three independent experiments are shown. |

ScRNA-seq reveals extensive cellular diversity in larval zebrafish intestinal epithelium.(A) Uniform manifold approximation and projection (UMAP) visualization of cell type clusters using combined fxr+/+ and fxr−/− single-cell transcriptomes (4710 cells from fxr+/+ and 5208 cells from fxr−/−). Clusters were hierarchically ordered in principal components analysis spaces and were numbered accordingly. Detailed annotations of each cluster are shown in table S1 and Supplementary Results. Clusters 4, 16, 17, and 9 are absorptive enterocytes (EC). (B) Dot plots showing relative expression of bile salt metabolism genes and anterior enterocyte markers in fxr+/+ cells throughout all clusters. |
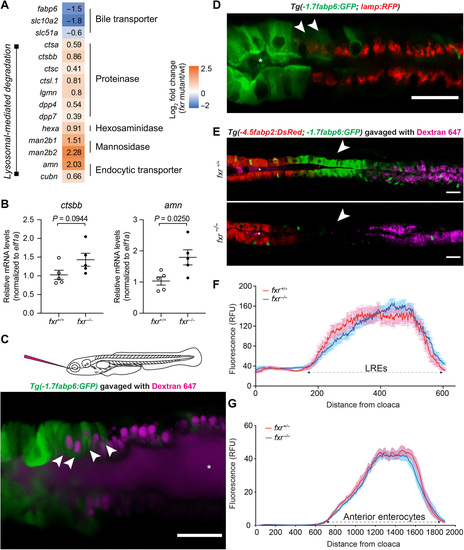
Fxr determines specific cell functions of ileal epithelial cells but is not required for establishment of regional boundaries.(A) Differential expression of genes related to bile metabolism and lysosomal functions in fxr−/− cells as compared to fxr+/+ cells in cluster 17. (B) qRT-PCR comparing expression of LRE markers in dissected intestines of gender- and size-matched adult fxr+/+ or fxr−/− zebrafish. The results are represented as relative expression levels normalized to the housekeeping gene ef1a (mean ± SEM). Statistical significance was calculated by unpaired t test. Representative data from two independent experiments are shown. (C) Confocal single-plane image of the intestinal epithelium in 7-dpf live larvae expressing the Tg(-1.7fabp6:GFP) transgene (green) following gavage with Alexa Fluor 647 dextran (magenta). White arrowheads mark GFP-expressing cells that uptake dextran. The schematic diagram depicting gavage approach for labeling lysosome-rich enterocytes (LREs) in the larval zebrafish intestine using fluorescent luminal cargo is shown in the top panel. Image is representative of six larvae examined. (D) Confocal three-dimensional projections of the intestinal epithelium of 7-dpf larvae expressing the Tg(-1.7fabp6:GFP) (green) and TgBAC(lamp2:RFP) (red) transgenes. White arrowheads mark cells showing both GFP and RFP (red fluorescent protein) expression. Image is representative of five larvae examined. (E) Confocal single-plane image of the intestinal epithelium in 7-dpf fxr+/+ (top) and fxr−/− (bottom) larvae expressing the Tg(-4.5fabp2:DsRed) (red) and Tg(-1.7fabp6:GFP) (green) transgenes following gavage with Alexa Fluor 647 dextran (magenta). White arrowheads mark the ileocyte region, which persists in fxr−/− larvae despite loss of GFP expression. Images are representative of five fxr+/+ and five fxr−/− larvae examined. Asteroids mark zebrafish lumen in (C) to (E). Scale bars, 25 μm. (F) Uptake profiles along LRE region following gavage with Alexa Fluor 647 dextran (1.25 mg/ml) in 7-dpf fxr+/− (n = 14) and fxr−/− (n = 22) larvae. (G) DsRed fluorescence along the intestine of 7-dpf fxr+/− (n = 18) and fxr−/− (n = 24) Tg(-4.5fabp2:DsRed) larvae. |

Fxr regulates differentiation and functions of anterior absorptive enterocytes in zebrafish.(A) FACS analysis comparing the relative abundance of anterior enterocytes in 7-dpf fxr+/+ and fxr−/− larvae expressing the Tg(-4.5fabp2:DsRed) and TgBAC(cldn15la-GFP) transgenes. The relative abundance was calculated by dividing the cell counts of DsRed+GFP+ double-positive cells by the cell counts of GFP+ single-positive cells (mean ± SEM). Statistical significance was calculated by unpaired t test. Representative data from two independent experiments are shown. (B) Comparisons between the genes that were differentially expressed in fxr−/− cells relative to fxr+/+ cells in cluster 4 and the mouse genes enriched in jejunal enterocytes/intestinal stem cells (ISCs) (49). Left: Venn diagram showing the number of overlapped genes between the two gene sets, of which the differentially expressed genes in fxr−/− cells were further classified based on the changes in their expression (up- or down-regulated) upon fxr mutation. Middle: Distributions of enterocyte- and ISC-enriched genes from the enterocyte/ISC dataset used in the current comparison. Right: Distribution of overlapped genes resulting from the comparison. (C) Top 3 HOMER-identified motifs enriched within accessible chromatin regions near genes that were down-regulated in the fxr−/− cells relative to fxr+/+ cells in cluster 4. The position weight matrices (PWMs) of the enriched nucleotide sequences are shown. The TF family that most closely matches the motif is indicated above the PWM. |