
- Title
-
10-Gingerol Suppresses Osteoclastogenesis in RAW264.7 Cells and Zebrafish Osteoporotic Scales
- Authors
- Zang, L., Kagotani, K., Nakayama, H., Bhagat, J., Fujimoto, Y., Hayashi, A., Sono, R., Katsuzaki, H., Nishimura, N., Shimada, Y.
- Source
- Full text @ Front Cell Dev Biol
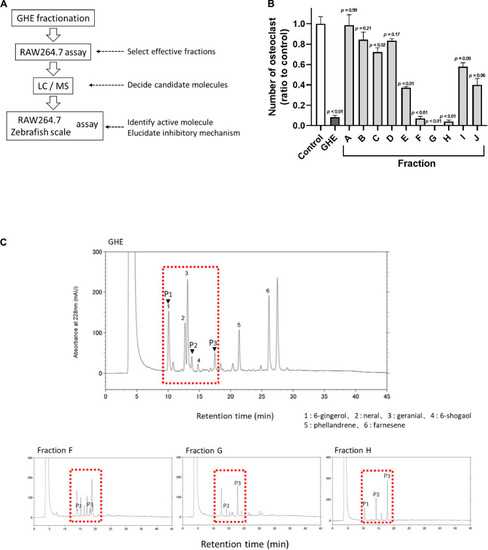
Ginger hexane extract (GHE) fractions containing gingerols suppress osteoclastogenesis in RAW264.7 cells. |
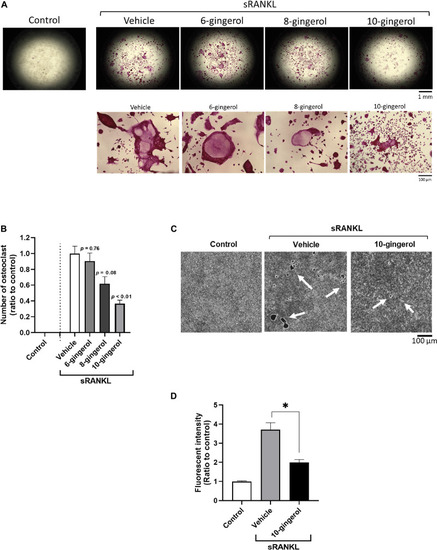
10-gingerol suppresses osteoclastogenesis in RAW264.7 cells. |
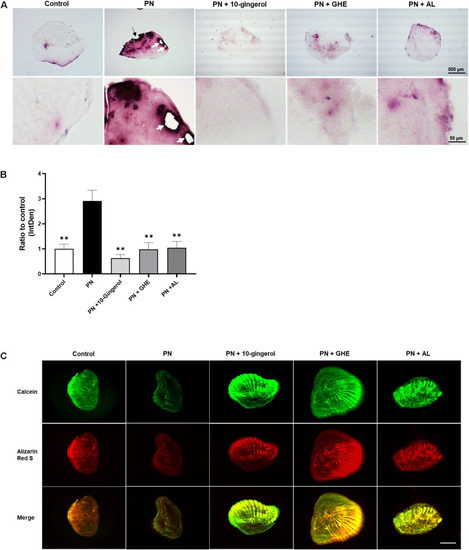
10-gingerol suppresses osteoclastogenesis in zebrafish osteoclastic scales. PHENOTYPE:
|
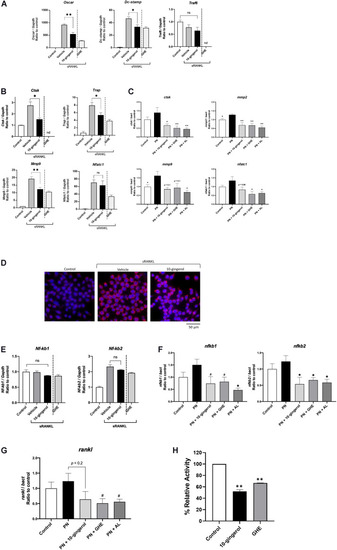
Gene expression analysis of RAW264.7 cells and zebrafish scales treated with 10-gingerol. |