FIGURE

FIGURE 3

ID
ZDB-FIG-210324-17
Publication
Zang et al., 2021 - 10-Gingerol Suppresses Osteoclastogenesis in RAW264.7 Cells and Zebrafish Osteoporotic Scales
Other Figures
All Figure Page
Back to All Figure Page
FIGURE 3

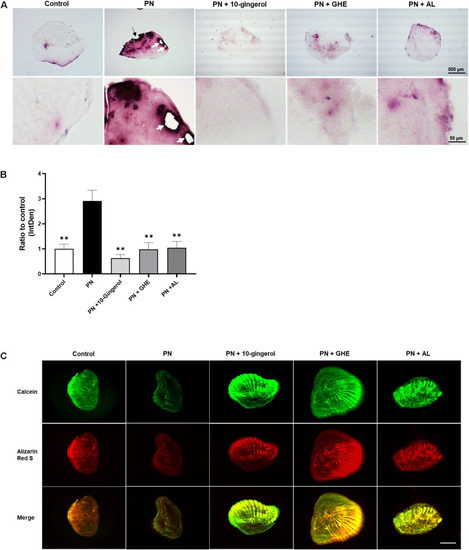
10-gingerol suppresses osteoclastogenesis in zebrafish osteoclastic scales. (A) Representative images for prednisolone (PN) treated regenerating zebrafish scales with 10-gingerol, GHE, or alendronate (AL; positive control). The lower panels show magnified images of the right lateral regions of the upper scales. Red color indicates the TRAP-positive area. The dark area in PN indicates the concentration of TRAP-positive cells. The black arrow indicates the resorbed edges, and white arrows show the resorption pits. For the experimental design of the zebrafish study, please see Supplementary Figure 2. (B) Quantitative analysis of (A). Integrative densities of the red areas were measured using ImageJ. n = 15–20, error bars indicate SE; ∗∗p < 0.01 vs. PN. (C) Scales after calcein and alizarin red S staining. The upper panels show calcein staining, Alizarin red staining, and merged images, respectively. Scale bar = 500 μm.

Expression Data

Expression Detail
Antibody Labeling
Phenotype Data
Fish:
Conditions:
Observed In:
Stage: Adult

Phenotype Detail
Acknowledgments
This image is the copyrighted work of the attributed author or publisher, and ZFIN has permission only to display this image to its users. Additional permissions should be obtained from the applicable author or publisher of the image. Full text @ Front Cell Dev Biol