FIGURE SUMMARY
Title

Probing the Effects of the FGFR-Inhibitor Derazantinib on Vascular Development in Zebrafish Embryos

Authors
Kotini, M.P., Bachmann, F., Spickermann, J., McSheehy, P.M., Affolter, M.
Source
Full text @ Pharmaceuticals (Basel)

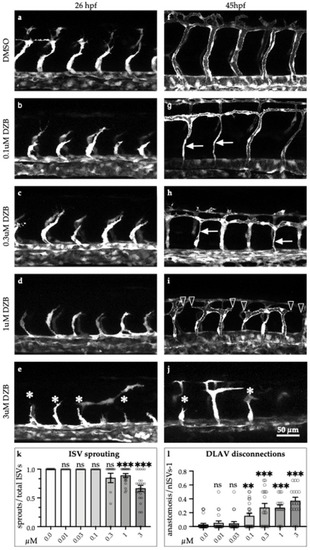
Derazantinib inhibits vascular development in vivo in a dose-dependent manner. Confocal images of GFP+ blood vessels in the trunk of Tg(fli1:EGFP)y1 zebrafish embryos at 26 hpf (ae) or 45 hpf (fj) after exposure to DMSO as vehicle control (a and f) or increasing concentrations of DZB in the swimming water (be and gj). Blood vessel development was disrupted using concentrations between 0.1 and 3 µM DZB. (k) Quantitative analysis of ISV sprouts that had reached the top roof and started to form the DLAV were normalised to the total number of ISVs per embryo (n ≥ 15 embryos per treatment were analysed from three independent experiments), embryos were treated using increasing concentrations of DZB. (l) Quantitative analysis of ISV sprouts that are disconnected at the DLAV were normalised to the total number of ISVs-1 (total number of connections) per embryo (n ≥ 15 embryos per treatment were analysed from three independent experiments) and embryos were treated using increasing concentrations of DZB. Data in k,l represent mean ± S.E.M. (error bars), ns: not significant, ** p < 0.01, *** p < 0.001. Arrows indicate thinner blood vessels, arrowheads show disconnected blood vessels and asterisks mark sprouting defects. Scale bar, 50 µm. ISV, intersegmental vessel; DLAV, dorsal longitudinal anastomotic vessel; DA, dorsal aorta; PCV, posterior cardinal vein. See also Figure S1.

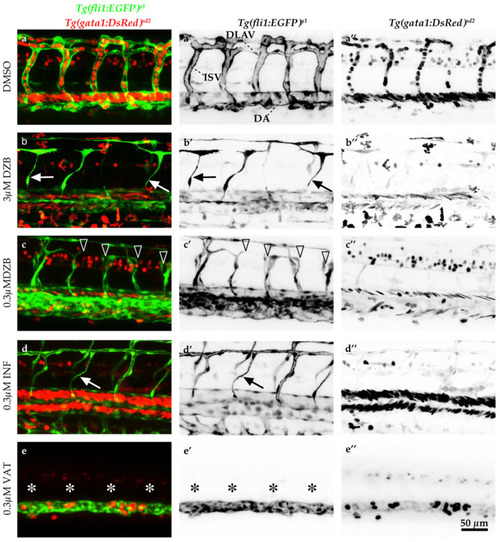
Comparisons of derazantinib, infigratinib and vatalanib blood vessel function. Confocal images of GFP+ blood vessels and DsRed+ erythrocytes in the trunk of Tg(fli1:EGFP)y1/Tg(gata1:DsRed)sd2 zebrafish embryos at 45 hpf after exposure to DMSO as control (a), derazantinib (DZB; b,c), infigratinib (INF; d) or vatalanib (VAT; e) in the swimming water. Panels a’e’ depict only the GFP channel and panels a’’e’’ depict only the DsRed channel. Although blood flow appeared in DZB and INF treatments at the dorsal aorta (DA), blood circulation was inhibited at the intersegmental vessels (ISVs) and dorsal longitudinal anastomotic vessel (DLAV) due to disruption of the vascular network (arrowheads) or due to thinner blood vessels (arrows) using DZB or INF treatments. Blood flow and blood vessel sprouting (asterisks) were disrupted in VAT treatment. Scale bar, 50 µm. See also Videos S1 and S2.

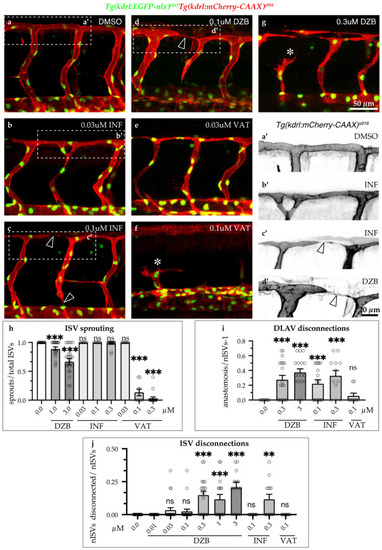
Comparisons of derazantinib, infigratinib and vatalanib during vascular development. Confocal images of GFP+ endothelial cell nuclei and mCherry+ endothelial cell membranes in Tg(kdrl:EGFP-nls)ubs1/Tg(kdrl:mCherry-CAAX)s916 transgenic embryos from 45 hpf in vehicle (DMSO, a) or embryos treated with INF (b,c), VAT (e,f) or DZB (d,g). Treatment with DZB or INF led to blood vessel disconnections (arrowheads) compared to control (ad). Panels a’–d’ depict zoom-in images of the outlined boxes in a–d marking blood vessel anastomosis defects (arrowheads), scale bar 20 µm. Treatment with DZB and VAT led to sprouting defects (asterisks; eg). Scale bar for ag, 50 µm. (h) Quantitative analysis of ISV sprouts that had reached the top roof and started to form the DLAV were normalised to the total number of ISVs per embryo (n ≥ 15 embryos per treatment were analysed from three independent experiments). (i) Quantitative analysis of ISV sprouts that were disconnected at the DLAV were normalised to the total number of ISVs-1 (total number of connections) per embryo (n ≥ 15 embryos per treatment were analysed from three independent experiments). (j) Quantitative analysis of ISV sprouts that are disconnected from the dorsal aorta were normalised to the total number of ISVs per embryo (total number of connections) per embryo (n ≥ 15 embryos per treatment were analysed from three independent experiments). Data in hj represent mean ± S.E.M. (error bars), ns: not significant, ** p < 0.01, *** p < 0.001. Statistical analysis was performed with the two-sided Mann–Whitney test. See also Figure S2.

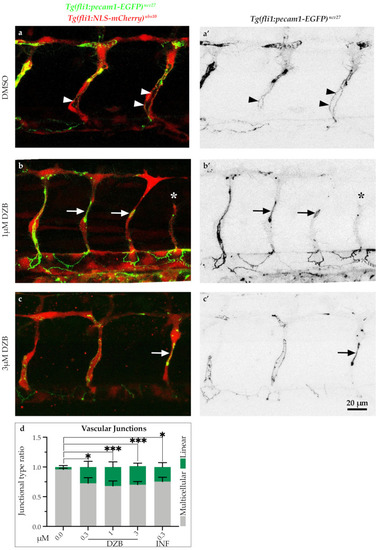
Derazantinib interferes with endothelial cell junctions. Confocal images of GFP+ endothelial cell junctions and mCherry+ endothelial cell nuclei in Tg(fli1:pecam1-EGFP)ncv27/Tg(fli1:NLS-mCherry)ubs10 transgenic embryos from 38 hpf after treatment with DMSO (control, a) or DZB (b and c). a’c’ depict only the GFP+ channel. Arrowheads point to multicellular continuous cell junctions, indicative in the control group (DMSO, a and a’), while arrows point to linear discontinuous junctions, indicative in the DZB-treated embryos (b and c’). The asterisk marks a sprouting defect (b and b’). (d) Quantification of ratio of continuous cell junctions to linear discontinuous junctions in ISVs per embryo (n ≥ 15 embryos per treatment were analysed from three independent experiments). Data in d represent mean ± S.E.M. (error bars), * p < 0.05, *** p < 0.001. Statistical analysis was performed with the two-sided Mann–Whitney test. Scale bar, 20 µm. See also Figure S3.

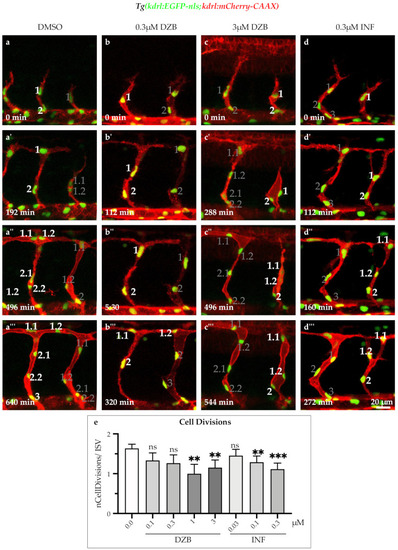
Derazantinib and infigratinib inhibit endothelial cell cycle. Time-lapse images of sprouting ISVs of GFP+ endothelial cell nuclei and mCherry+ endothelial cell membranes in Tg(kdrl:EGFP-nls)ubs1/Tg(kdrl:mCherry-CAAX)s916 transgenic embryos from 26 hpf after treatment with DMSO (aa’’’), 0.3 uM DZB (bb’’’), 3 uM DZB (c-c’’’) or 0.3 uM INF(dd’’’). Numbers indicate cell nuclei (i.e., 1, 2, 3,...) or cell nuclei arising after cell division (i.e., 1.1, 1.2,...). Number of mitotic endothelial cells was reduced in DZB-treated (cc’’’) or INF-treated embryos (dd’’’). (e) Quantitative analysis of mitotic endothelial cells in ISVs per embryo (n ≥ 10 embryos per treatment were analysed from three independent experiments). Data in e represent mean ± S.E.M. (error bars), ns: not significant, ** p < 0.01, *** p < 0.001. Statistical analysis was performed with the two-sided Mann–Whitney test. Scale bar, 20 µm. See also Figure S4 and Videos S3–S6.

Acknowledgments
This image is the copyrighted work of the attributed author or publisher, and ZFIN has permission only to display this image to its users. Additional permissions should be obtained from the applicable author or publisher of the image. Full text @ Pharmaceuticals (Basel)