IMAGE

Figure 2

ID
ZDB-IMAGE-210125-42
Source
Figures for Kotini et al., 2020
Image
Figure Caption

Figure 2

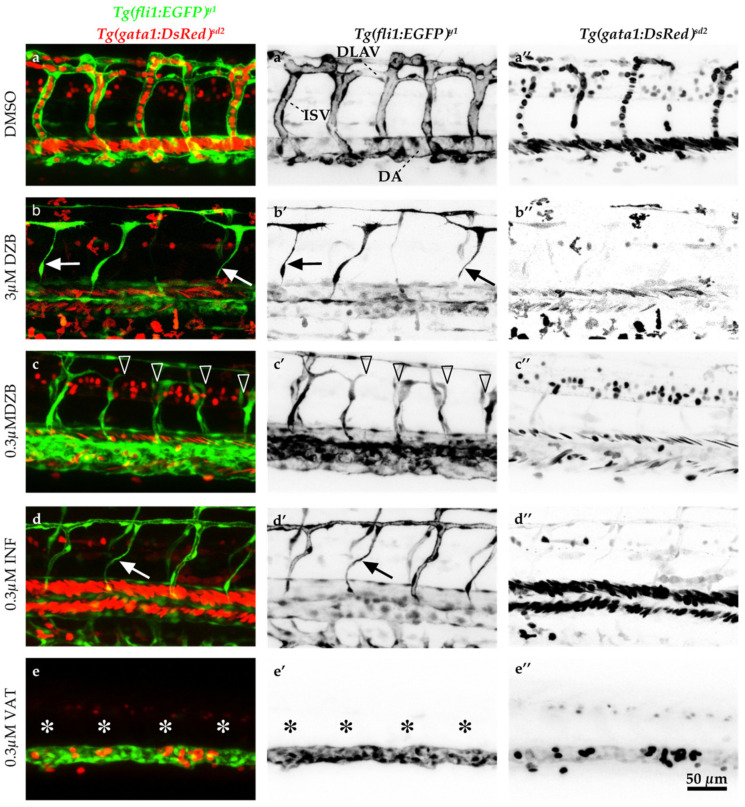
Comparisons of derazantinib, infigratinib and vatalanib blood vessel function. Confocal images of GFP+ blood vessels and DsRed+ erythrocytes in the trunk of Tg(fli1:EGFP)y1/Tg(gata1:DsRed)sd2 zebrafish embryos at 45 hpf after exposure to DMSO as control (a), derazantinib (DZB; b,c), infigratinib (INF; d) or vatalanib (VAT; e) in the swimming water. Panels a’e’ depict only the GFP channel and panels a’’e’’ depict only the DsRed channel. Although blood flow appeared in DZB and INF treatments at the dorsal aorta (DA), blood circulation was inhibited at the intersegmental vessels (ISVs) and dorsal longitudinal anastomotic vessel (DLAV) due to disruption of the vascular network (arrowheads) or due to thinner blood vessels (arrows) using DZB or INF treatments. Blood flow and blood vessel sprouting (asterisks) were disrupted in VAT treatment. Scale bar, 50 µm. See also Videos S1 and S2.

Acknowledgments
This image is the copyrighted work of the attributed author or publisher, and ZFIN has permission only to display this image to its users. Additional permissions should be obtained from the applicable author or publisher of the image. Full text @ Pharmaceuticals (Basel)