FIGURE

Figure 5

ID
ZDB-FIG-210125-45
Publication
Kotini et al., 2020 - Probing the Effects of the FGFR-Inhibitor Derazantinib on Vascular Development in Zebrafish Embryos
Other Figures
All Figure Page
Back to All Figure Page
Figure 5

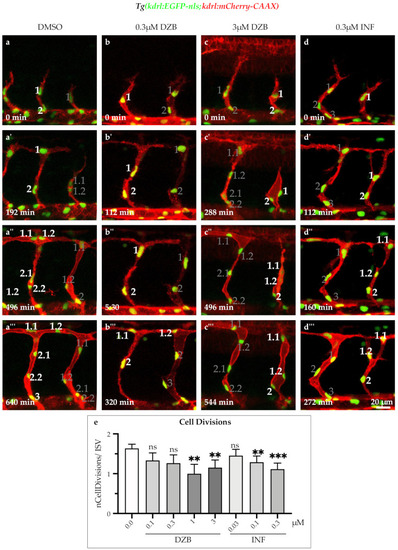
Derazantinib and infigratinib inhibit endothelial cell cycle. Time-lapse images of sprouting ISVs of GFP+ endothelial cell nuclei and mCherry+ endothelial cell membranes in Tg(kdrl:EGFP-nls)ubs1/Tg(kdrl:mCherry-CAAX)s916 transgenic embryos from 26 hpf after treatment with DMSO (aa’’’), 0.3 uM DZB (bb’’’), 3 uM DZB (c-c’’’) or 0.3 uM INF(dd’’’). Numbers indicate cell nuclei (i.e., 1, 2, 3,...) or cell nuclei arising after cell division (i.e., 1.1, 1.2,...). Number of mitotic endothelial cells was reduced in DZB-treated (cc’’’) or INF-treated embryos (dd’’’). (e) Quantitative analysis of mitotic endothelial cells in ISVs per embryo (n ≥ 10 embryos per treatment were analysed from three independent experiments). Data in e represent mean ± S.E.M. (error bars), ns: not significant, ** p < 0.01, *** p < 0.001. Statistical analysis was performed with the two-sided Mann–Whitney test. Scale bar, 20 µm. See also Figure S4 and Videos S3–S6.

Expression Data

Expression Detail
Antibody Labeling
Phenotype Data

Phenotype Detail
Acknowledgments
This image is the copyrighted work of the attributed author or publisher, and ZFIN has permission only to display this image to its users. Additional permissions should be obtained from the applicable author or publisher of the image. Full text @ Pharmaceuticals (Basel)