IMAGE

Figure 4

ID
ZDB-IMAGE-210125-44
Source
Figures for Kotini et al., 2020
Image
Figure Caption

Figure 4

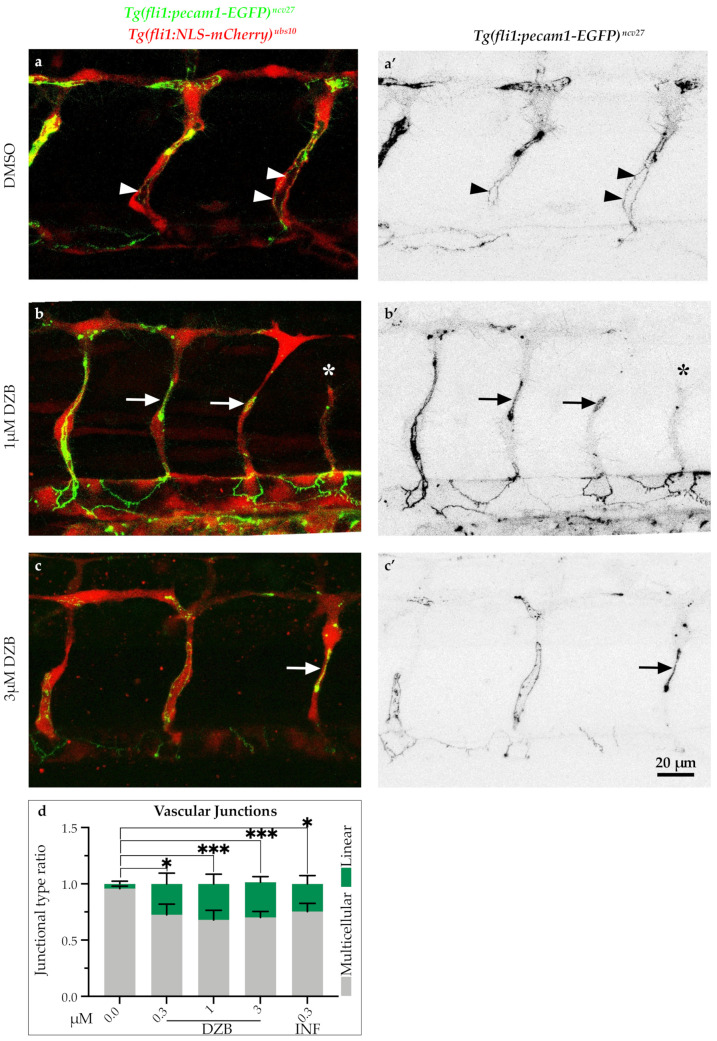
Derazantinib interferes with endothelial cell junctions. Confocal images of GFP+ endothelial cell junctions and mCherry+ endothelial cell nuclei in Tg(fli1:pecam1-EGFP)ncv27/Tg(fli1:NLS-mCherry)ubs10 transgenic embryos from 38 hpf after treatment with DMSO (control, a) or DZB (b and c). a’c’ depict only the GFP+ channel. Arrowheads point to multicellular continuous cell junctions, indicative in the control group (DMSO, a and a’), while arrows point to linear discontinuous junctions, indicative in the DZB-treated embryos (b and c’). The asterisk marks a sprouting defect (b and b’). (d) Quantification of ratio of continuous cell junctions to linear discontinuous junctions in ISVs per embryo (n ≥ 15 embryos per treatment were analysed from three independent experiments). Data in d represent mean ± S.E.M. (error bars), * p < 0.05, *** p < 0.001. Statistical analysis was performed with the two-sided Mann–Whitney test. Scale bar, 20 µm. See also Figure S3.

Acknowledgments
This image is the copyrighted work of the attributed author or publisher, and ZFIN has permission only to display this image to its users. Additional permissions should be obtained from the applicable author or publisher of the image. Full text @ Pharmaceuticals (Basel)