FIGURE SUMMARY
Title

Naringin attenuates cisplatin- and aminoglycoside-induced hair cell injury in the zebrafish lateral line via multiple pathways

Authors
Li, M., Liu, J., Liu, D., Duan, X., Zhang, Q., Wang, D., Zheng, Q., Bai, X., Lu, Z.
Source
Full text @ J. Cell. Mol. Med.

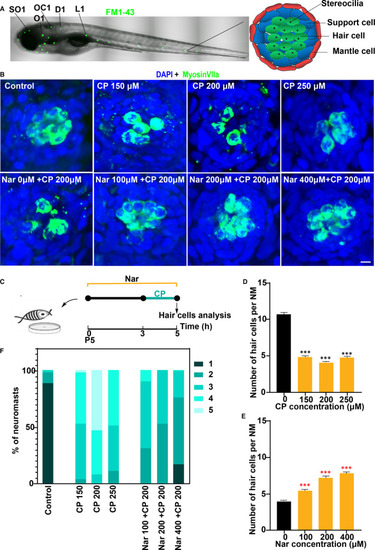
Nar protects against cisplatin ototoxicity. (A) Confocal image of a 5 d post‐fertilization (dpf) zebrafish. The neuromasts analysed in this experiment are indicated by black lines: SO1(supraorbital 1), O1 (otic 1), OC1(occipital 1), D1(dorsal trunk 1) and L1(lateral 1). Schematic top view of a 5 dpf neuromast showing the different cell types is shown in the right. (B) Animals were fixed and immunostained for MyosinVIIa (green) and DAPI. 5dpf zebrafish were incubated with 0, 150, 200 and 250 μmol/L cisplatin (CP) for 2 h, or pre‐treated with 0 µmol/L to 400 µmol/L of Naringin(Nar) for 3 h and then co‐treated with Nar and CP (150 µmol/L) for 2 h. (C) Diagram of the assay for B. (D and E) Quantification of the number of hair cells (MyosinVIIa+) per neuromast after the different treatments represented as mean ± SEM (n = 10). Control animals were exposed to vehicle alone (DMSO). ***P < 0.001. Black asterisks compared to DMSO‐treated animals. Red asterisks compared versus the corresponding CP concentration. (F) Scores for neuromast morphology of each group (The grading criteria are shown in the Materials and Methods). Scale bar in A equals 500 μm, B equals 5 μm

Nar protects against gentamicin ototoxicity. (A) Animals were fixed and immunostained for MyosinVIIa (green) and DAPI. 5 dpf zebrafish were incubated with 0 μmol/L to 150 μmol/L GM for 3 h or pre‐treated with 0 µmol/L to 400 µmol/L of Nar for 3 h and then co‐treated with Nar and GM (100 µmol/L) for 3 h. (B) Diagram of the assay for A. (C and D) Quantification of the number of hair cells (MyosinVIIa+) per neuromast after the different treatments represented as mean ± SEM (n = 10). Control animals were exposed to vehicle alone (DMSO). **P < 0.01, ***P < 0.001. Black asterisks compared to DMSO‐treated animals. Red asterisks compared versus the corresponding GM concentration. (E) Scores for neuromast morphology of each group (see Materials and Methods). Scale bar equals 5μm

Nar protects against neomycin ototoxicity. (A) Animals were fixed and immunostained for MyosinVIIa (green), and DAPI. 5 dpf zebrafish were incubated with 0 μmol/L to 150 μmol/L Neo for 1 h, or pre‐treated with 0 µmol/L to 400 µmol/L of Nar for 3 h and then co‐treated with Nar and Neo (100 µmol/L) for 3 h. (B) Diagram of the assay for A. (C and D) Quantification of the number of hair cells (MyosinVIIa+) per neuromast after the different treatments represented as mean ± SEM (n = 10). Control animals were exposed to vehicle alone (DMSO). ***P < 0.001. Black asterisks compared to DMSO‐treated animals. Red asterisks compared versus the corresponding Neo concentration. (E) Scares for neuromast morphology of each group(see Materials and Methods). Scale bar equals 5 μm

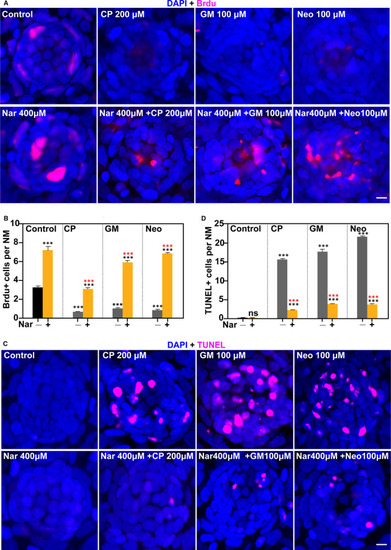
Nar promotes cell proliferation and protects against ototoxin‐induced cell death in neuromasts. (A) Proliferation assays were performed in 5 dpf zebrafish in the presence/absence of Nar (400 µmol/L) and the corresponding ototoxin. Animals were fixed and immunostained for BrdU (pink) and DAPI. (B) The numbers of proliferated cells (BrdU+) per neuromast were calculated for each treatment and represented as mean ± SEM (n = 10). ***P < 0.001. Black asterisks compared versus corresponding control. Red asterisk compared versus the corresponding ototoxin‐only treatment. (C) TUNEL assay (red) was performed in zebrafish in the presence/absence of Nar (400 µmol/L) and the corresponding ototoxin. (D) The numbers of TUNEL‐positive cells per neuromast were calculated for each treatment and represented as mean ± SEM (n = 10). ***P < 0.001. Black asterisks compared versus corresponding control. Red asterisk compared versus the corresponding ototoxin‐only treatment. Scale bar equals 5 μm

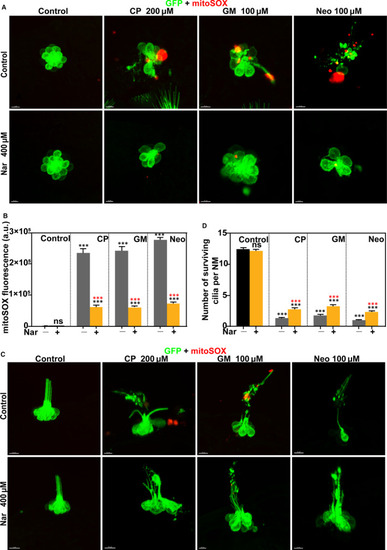
Protective effect of naringin against Mitochondrial oxidative stress and cilia damage. Zebrafish were treated with different concentrations of ototoxic drugs with or without Nar. Control animals were exposed to vehicle alone (DMSO). Still images of live brn3c: GFP hair cells (green) loaded with the live fluorescent indicator mitoSOX (red). (A) The top view of hair cell clusters to show the morphology of hair cells. (B) The mitoSOX fluorescent intensity per neuromast was calculated for each treatment and represented as mean ± SEM. ***P < 0.001. Black asterisks compared to DMSO‐treated animals. Red asterisks compared versus the corresponding ototoxin‐only treatment. (C) Side view of hair cell clusters to show hair cell cilia. (D) Quantification of the number of surviving cilia per neuromast after the different treatments represented as mean ± SEM. ***P < 0.001. Black asterisks compared to DMSO‐treated animals. Red asterisks compared versus the corresponding ototoxin‐only treatment

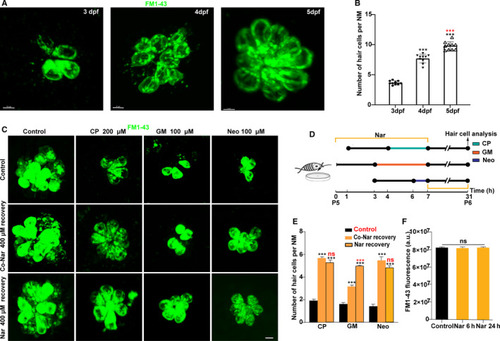
Naringin promotes the regeneration of functional hair cells. A, Still imaging of hair cells of zebrafish larvae 3, 4 and 5 d after FM1‐43 labelled (green) fertilization. B, Scatter plot of FM1‐43 labelled hair cell count at each time‐point (***P < 0.001; mean ± SEM; n = 10). Black asterisks correspond to 3 dpf animals, red asterisks correspond to 4 dpf animals. Hair cells with mechanotransduction channel activity (FM1‐43+, green) are defined as functional and mature hair cells. (C) Still imaging of hair cells after different treatment: 5 dpf Wild‐type larvae were incubated with vehicle alone for 24 h after being treated with vehicle or serial dilutions of Ototoxic drugs (Control group), or with Nar 400 µmol/L prevention and co‐incubation treatment (Co‐Nar recovery group); larvae were treated by ototoxic drugs and then incubated with Nar for 24 h (Nar recovery group); 5 dpf zebrafish were incubated with Nar for 6 h or 24 h as the corresponding control. Scale bar equals 5 µm. (D) Diagram of the assay for C. (E) The FM1‐43 fluorescent intensity per neuromast was calculated for each treatment and represented as mean ± SEM. No significant differences were observed between control and treated animals (unpaired Student's t test). (F) Quantification of the number of functional hair cells per neuromast after the different treatments represented as mean ± SEM. ***P < 0.001. Black asterisks compared versus control. Red asterisks compared versus the corresponding Nar concentration

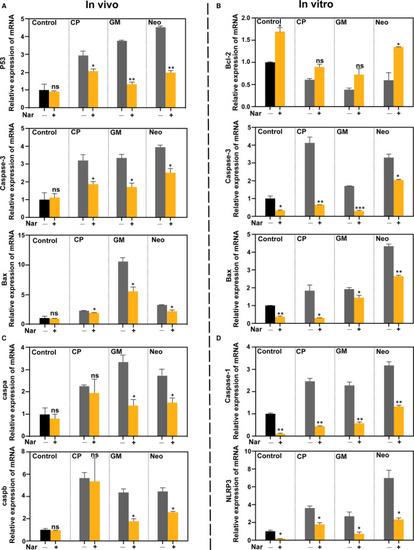
Naringin attenuates the activation of the apoptotic‐ and pyroptosis‐related pathway in vitro and in vivo. (A and C) Real‐time PCR analysis of the mRNA levels of apoptotic (P53, Bax, Caspase‐3) and pyroptosis (caspb, caspa) related genes in zebrafish larvae treated with the presence/absence of Nar (400 µmol/L) and the corresponding ototoxin (CP 200 µmol/L, GM 100 µmol/L, Neo 100 µmol/L). Data are expressed as the mean ± SEM. ***P < 0.001, **P < 0.01, *P < 0.05. Black asterisks compared versus corresponding control. (B and D) Real‐time PCR analysis of the mRNA levels of apoptotic‐ (Bcl‐2, Bax, Caspase‐3) and pyroptosis‐ (Caspase‐1, NLRP3) related genes in HEI‐OC1 cells treated with the presence/absence of Nar (100 µmol/L) and the corresponding ototoxin (CP 10 µg/mL, GM 50 µmol/L, Neo 50 µmol/L). Data are expressed as mean ± SEM. ***P < 0.001, **P < 0.01, *P < 0.05. Black asterisks compared versus corresponding control

Acknowledgments
This image is the copyrighted work of the attributed author or publisher, and ZFIN has permission only to display this image to its users. Additional permissions should be obtained from the applicable author or publisher of the image. Full text @ J. Cell. Mol. Med.