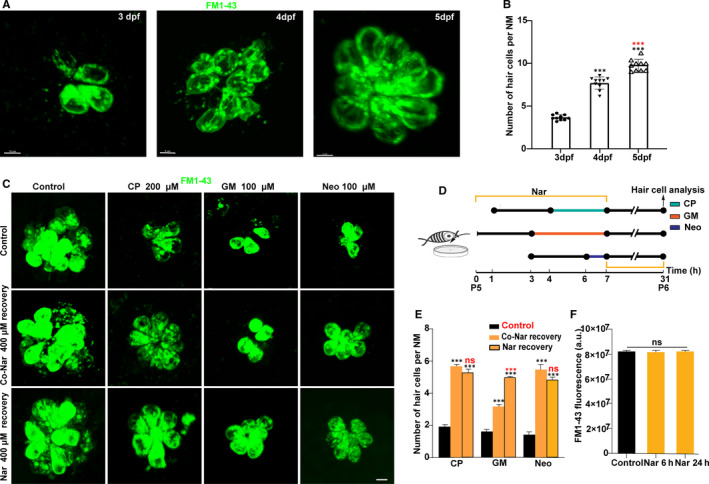
IMAGE

FIGURE 6

ID
ZDB-IMAGE-210125-14
Source
Figures for Li et al., 2020
Image
Figure Caption

FIGURE 6

Naringin promotes the regeneration of functional hair cells. A, Still imaging of hair cells of zebrafish larvae 3, 4 and 5 d after FM1‐43 labelled (green) fertilization. B, Scatter plot of FM1‐43 labelled hair cell count at each time‐point (***P < 0.001; mean ± SEM; n = 10). Black asterisks correspond to 3 dpf animals, red asterisks correspond to 4 dpf animals. Hair cells with mechanotransduction channel activity (FM1‐43+, green) are defined as functional and mature hair cells. (C) Still imaging of hair cells after different treatment: 5 dpf Wild‐type larvae were incubated with vehicle alone for 24 h after being treated with vehicle or serial dilutions of Ototoxic drugs (Control group), or with Nar 400 µmol/L prevention and co‐incubation treatment (Co‐Nar recovery group); larvae were treated by ototoxic drugs and then incubated with Nar for 24 h (Nar recovery group); 5 dpf zebrafish were incubated with Nar for 6 h or 24 h as the corresponding control. Scale bar equals 5 µm. (D) Diagram of the assay for C. (E) The FM1‐43 fluorescent intensity per neuromast was calculated for each treatment and represented as mean ± SEM. No significant differences were observed between control and treated animals (unpaired Student's t test). (F) Quantification of the number of functional hair cells per neuromast after the different treatments represented as mean ± SEM. ***P < 0.001. Black asterisks compared versus control. Red asterisks compared versus the corresponding Nar concentration

Acknowledgments
This image is the copyrighted work of the attributed author or publisher, and ZFIN has permission only to display this image to its users. Additional permissions should be obtained from the applicable author or publisher of the image. Full text @ J. Cell. Mol. Med.