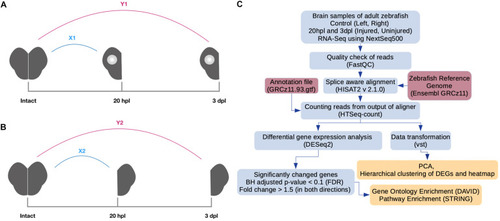
Pipeline for RNA preparation and analysis of RNA sequencing (RNA-seq) data. (A) Preparation of RNA samples from the lesioned hemispheres at 20 hpl or 3 dpl. X1: comparison of the lesioned hemisphere at 20 hpl with the intact brain; Y1: comparison of the lesioned hemisphere at 3 dpl with the intact brain. (B) Preparation of RNA samples from the unlesioned hemispheres at 20 hpl or 3 dpl. X2: comparison of the unlesioned hemisphere at 20 hpl with the intact brain; Y2: comparison of the unlesioned hemisphere at 3 dpl with the intact brain. (C) RNA-seq reads were generated using Illumina NextSeq 500. The quality of reads was checked by the FastQC tool. Next, alignment and counting of reads were performed by using a zebrafish reference genome (Ensembl, GRCz11) and the annotation file (Ensembl, GRCz11.93) by HISAT2 and HTSeq-count tools, respectively. Counts were transformed with variance stabilizing transformation (vst) to perform principal component analysis and hierarchical clustering. To select genes as differentially expressed, we used the DESeq2 package with the following criteria: fold change > 1.5 (in both directions) and Benjamini–Hochberg adjusted p-value (FDR) < 0.1. Gene Ontology and pathway enrichment analyses were performed by using DAVID and the STRING tool of Cytoscape, respectively. hpl, hours post-lesion; dpl, days post-lesion.

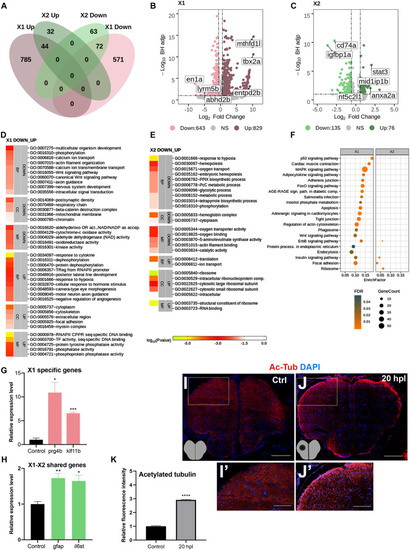
Transcriptome profiling of the telencephalon during the early wound healing stage of regeneration. (A) The Venn diagram shows the number of upregulated (Up) or downregulated (Down) differentially expressed genes (DEGs) in the lesioned (X1, pink) and unlesioned (X2, green) hemispheres and the overlap between each set of DEGs at 20 hpl. A total of 1,472 and 211 genes were significantly changed in X1 and X2, respectively. There were 116 genes shared between X1 and X2. (B,C) Volcano plots representing changes in the gene expression levels in X1 and X2. Each point represents a gene. The X-axis shows log2 of fold change in the condition compared to control and the vertical dashed lines indicate the fold change cutoffs. The Y-axis represents -log10 of the Benjamini–Hochberg adjusted p-value, where the significance threshold is indicated by the dashed horizontal line. Number of upregulated genes in X1 and X2: 829 and 76, respectively, and downregulated genes in X1 and X2: 643 and 135, respectively. Darker and lighter shades in (A–C) indicate upregulation and downregulation, respectively. (D,E) DAVID bioinformatics tool was used to show the most significantly enriched GO terms based on the transcriptional changes in X1 and X2 comparisons. The heatmap scale shows log10 of the EASE p-value for the most significantly enriched GO terms. (F) STRING bioinformatics tool was used to show the most significantly enriched KEGG pathways based on the transcriptional changes in X1 and X2. The dot plot represents KEGG pathways enriched in X1 and X2 by using all significantly changed genes in these comparisons based on FDR and EnrichFactor. (G,H) Relative expression levels of X1-specific genes (prg4b and klf11b) and the genes shared between X1 and X2 (gfap and il6st). Statistical significance was evaluated using unpaired t-test. *p < 0.05, **p < 0.01, and ***p < 0.001. Error bars represent ± standard error of the mean (SEM, n = 3). (I–I′,J–J′) Anti-acetylated tubulin staining of the control and 20 hpl brain sections with boxed areas magnified. Sections are counterstained for DAPI. Scale bars, 200 μm in (I,J); 100 μm in (I′) and (J′). (K) Relative fluorescence intensity in brain sections stained for anti-acetylated tubulin. DAVID, Database for Annotation, Visualization and Integrated Discovery; GO, Gene Ontology; BP, biological process; CC, cellular component; MF, molecular function; STRING, Search Tool for the Retrieval of Interacting Genes/Proteins; KEGG, Kyoto Encyclopedia of Genes and Genomes; FDR, false discovery rate; hpl, hours post-lesion. See section “Materials and Methods” for the definition of DEGs covered in X and Y comparisons. *p < 0.05, **p < 0.01, ***p < 0.001, and ****p < 0.0001.

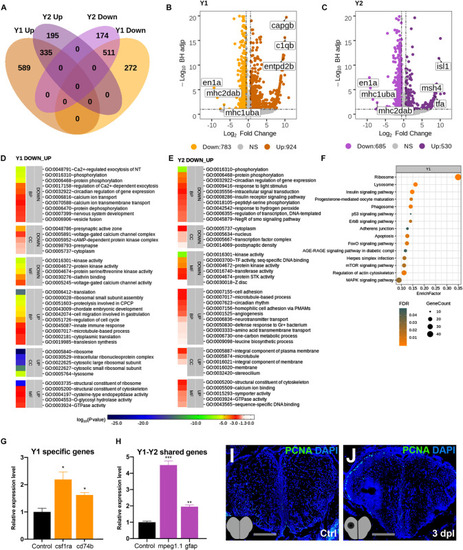
Transcriptome profiling of the telencephalon during the early proliferative stage of regeneration. (A) The Venn diagram shows the number of upregulated (Up) or downregulated (Down) differentially expressed genes (DEGs) in the lesioned (Y1, orange) and unlesioned (Y2, purple) hemispheres and the overlap between each set of DEGs at 3 dpl. A total of 1,707 and 1,215 genes were significantly changed in Y1 and Y2, respectively. There were 846 genes shared between Y1 and Y2. (B,C) Volcano plots representing changes in the gene expression levels in Y1 and Y2. Each point represents a gene. The X-axis shows log2 of fold change in the condition compared to the control and dashed vertical lines indicate the fold change cutoff. The Y-axis represents -log10 of the Benjamini–Hochberg adjusted p-value, where the significance threshold is indicated by the dashed horizontal line. Number of upregulated genes in Y1 and Y2: 924 and 530, respectively, and downregulated genes in Y1 and Y2: 783 and 685, respectively. Darker and lighter shades in (A–C) indicate upregulation and downregulation, respectively. (D,E) DAVID bioinformatics tool was used to show the most significantly enriched GO terms based on the transcriptional changes in Y1 and Y2 comparisons. The heatmap scale shows log10 of the EASE p-value for the most significantly enriched GO terms. (F) STRING bioinformatics tool was used to show the most significantly enriched KEGG pathways based on the transcriptional changes in X1 and X2. The dot plot represents KEGG pathways enriched in X1 and X2 by using all significantly changed genes in these comparisons based on FDR and EnrichFactor. (G,H) Relative expression levels of Y1-specific genes (csf1ra and cd74b) and the genes shared between Y1 and Y2 (mpeg1.1 and gfap). Statistical significance was evaluated using unpaired t-test. *p < 0.05, **p < 0.01, and ***p < 0.001. Error bars represent ± standard error of the mean (SEM, n = 3). (I,J) Anti-PCNA staining of the control and 3 dpl brain sections. Sections are counterstained for DAPI. DAVID, Database for Annotation, Visualization and Integrated Discovery; GO, Gene Ontology; BP, biological process; CC, cellular component; MF, molecular function; STRING, Search Tool for the Retrieval of Interacting Genes/Proteins; KEGG, Kyoto Encyclopedia of Genes and Genomes; FDR, false discovery rate; dpl, days post-lesion. See section “Materials and Methods” for the definition of DEGs covered in X and Y comparisons.

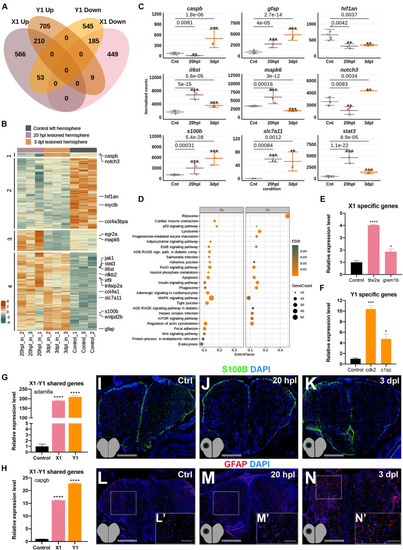
Early wound healing and proliferative stages of brain regeneration are more different than similar. (A) The Venn diagram shows the number of upregulated (Up) or downregulated (Down) differentially expressed genes (DEGs) in the lesioned 20-hpl (X1, pink) and lesioned 3-dpl (Y1, orange) hemispheres and the overlap between each set of DEGs. Out of 1,472 genes, 1,015 were significantly changed only in X1, while 1,250 out of 1,707 genes were so in Y1. There were 457 genes shared between X1 and Y1. Darker and lighter shades indicate upregulation and downregulation, respectively. (B) The heatmap shows the expressions of genes shared between X1 and Y1. Each column represents a single hemisphere from a single telencephalon and each row shows a single gene. The scale bar shows counts Z-scores from high to low expression, represented by a color gradient from orange to green, respectively. (C) Dot plot representation of normalized transformed read counts of a representative set of genes shared between X1 and Y1 (gray: control samples; pink: 20-hpl lesioned hemisphere; orange: 3 dpl lesioned hemisphere). The mean ± standard deviations (SD) of three independent experiments are plotted. (D) STRING bioinformatics tool was used to show the most significantly enriched KEGG pathways based on the transcriptional changes in X1 and X2. The dot plot represents KEGG pathways enriched in X1 and Y1 by using all significantly changed genes in these comparisons based on FDR and EnrichFactor. (E,F) Relative expression levels of DEGs that are unique to X1 (tbx2a and grem1b) or unique to Y1 (cdk2 and c1qc). (G,H) Relative expression levels of DEGs shared between X1 and Y1 (adam8a and capgb). Statistical significance was evaluated using unpaired t-test. ****p < 0.0001. Error bars represent ± standard error of the mean (SEM, n = 3). (I–K) Anti-S100β staining of the control, 20 hpl, and 3 dpl brain sections. (L–N,L′–N′) Anti-GFAP staining of the control, 20 hpl, and 3 dpl brain sections with boxed areas magnified. Sections are counterstained for DAPI. Scale bars, 200 μm in (L–N); 100 μm in (L′–N′). STRING, Search Tool for the Retrieval of Interacting Genes/Proteins; KEGG, Kyoto Encyclopedia of Genes and Genomes; FDR, false discovery rate; hpl, hours post-lesion; dpl, days post-lesion. See section “Materials and Methods” for the definition of DEGs covered in X and Y comparisons. *p < 0.05, **p < 0.01, ***p < 0.001, and ****p < 0.0001.

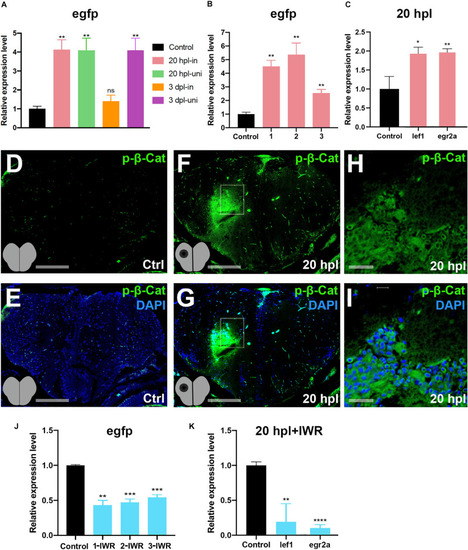
Wnt/β-catenin signaling is activated during the early wound healing stage in the regenerating brain. (A) Relative expression levels of egfp as a reporter of Wnt/β-catenin signaling activity in the lesioned and unlesioned hemispheres of the telencephalon during the early wound healing and proliferative stages of regeneration. Three hemispheres were pooled for each sample. (B) Relative expression levels of EGFP as a reporter of Wnt/β-catenin signaling activity in the lesioned hemispheres of three independent telencephalon samples used for RNA sequencing during the early wound healing stage. (C) Relative expression levels of the known Wnt target genes lef1 and egr2a in the lesioned hemisphere of the telencephalon during the early wound healing stage. (D,E) Anti-phospho-β-catenin staining of control brain sections. (F,G) Anti-phospho-β-catenin staining of 20-hpl brain sections. The lesioned area is boxed and shown in (H,I). Sections are counterstained for DAPI. Scale bars, 200 μm in (D–G); 25 μm in (H,I). (J) Relative expression levels of egfp as a reporter of Wnt/β-catenin signaling activity in lesioned + IWR-1-treated hemispheres of three independent telencephalon samples collected at 20 hpl. (K) Relative expression levels of the Wnt target genes lef-1 and egr2a in the pooled three lesioned + IWR-1-treated hemispheres at 20 hpl. Statistical significance was evaluated using unpaired t-test. **p < 0.01 and ***p < 0.001. Error bars represent ± standard error of the mean (SEM, n = 3). hpl, hours post-lesion. *p < 0.05, **p < 0.01, ***p < 0.001, and ****p < 0.0001.

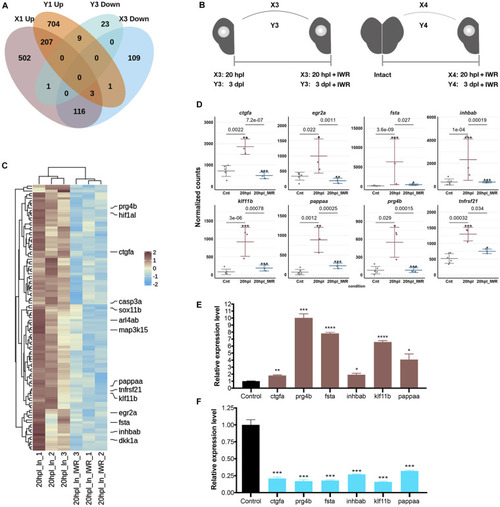
Inhibition of Wnt/β-catenin signaling during the early wound healing stage identifies 119 target genes that are positively regulated by the pathway. (A) The Venn diagram shows the number of differentially expressed genes (DEGs) that are upregulated (Up) in the lesioned 20-hpl (X1, dark pink), downregulated (Down) in the lesioned + IWR-1-treated 20-hpl (X3, light blue), Up in the lesioned 3-dpl (Y1, dark orange), or Down in the lesioned + IWR-1-treated 3-dpl (Y3, turquoise) hemispheres and the overlap between each set of DEGs. There were 119 genes Up in X1 and Down in X3, while only nine genes were Up in Y1 and Down in Y3. (B) Preparation of RNA samples from the lesioned hemisphere at 20 hpl or 3 dpl. X3: 20-hpl lesioned hemisphere after IWR treatment vs. 20-hpl lesioned hemisphere; Y3: 3-dpl lesioned hemisphere after IWR treatment vs. 3-dpl lesioned hemisphere; X4: 20-hpl lesioned hemisphere after IWR treatment vs. control; Y4: 3-dpl lesioned hemisphere after IWR treatment vs. control. (C) The heatmap shows the Wnt target genes that are Up in X1 and Down in X3. Each column represents a single hemisphere from a single telencephalon and each row shows a single gene. The scale bar shows counts Z-scores from high to low expression, represented by a color gradient from orange to green, respectively. (D) Dot plot representation of normalized transformed read counts of a representative set of Wnt target genes that are Up in X1 and Down in X3 (brown: 20-hpl lesioned hemispheres; blue: 20-hpl lesioned + IWR-1-treated hemispheres). The mean ± standard deviations (SD) of three independent experiments are plotted. (E,F) Relative expression levels of the Wnt target genes that are Up in X1 and Down in X3 (ctgfa, prg4b, fsta, inhbab, klf11b, and pappaa). Statistical significance was evaluated using unpaired t-test. *p < 0.05, **p < 0.01, ***p < 0.001, and ****p < 0.0001. Error bars represent ± standard error of the mean (SEM, n = 3). See section “Materials and Methods” for the definition of DEGs covered in X and Y comparisons.

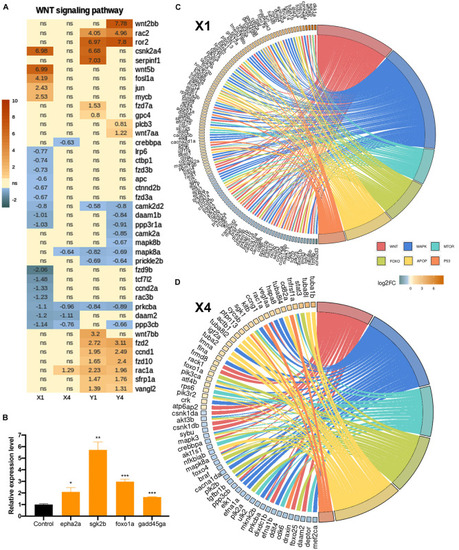
Inhibition of Wnt/β-catenin signaling during the early wound stage results in a marked alteration of the gene expression profiles represented in Kyoto Encyclopedia of Genes and Genomes (KEGG) pathway enrichment. Heatmap representation of the uniquely changed genes in (A) the Wnt signaling pathway in X1, X4, Y1, and Y4 comparisons. Each column represents a comparison according to the DESeq2 results and each row shows a single gene. The scale bar shows log2 of the fold change values (when statistically significant) from high to low fold change, represented by a color gradient from orange to blue, respectively. Statistical significance was evaluated using Wald test. ns, non-significant. (B,C) GOChord plot of selected GO terms belonging to the biological process (BP) sub-ontology and KEGG pathways for X1 and X4 comparisons, respectively. The genes related to the Wnt-KEGG pathway and Wnt-Gene Ontology BP are intersected and represented as one group. The genes are linked to their assigned pathways by ribbons and ordered according to their log2 of the fold change values from high to low fold change, represented by a color gradient from orange to blue, respectively. (D) Relative expression levels of pathway-related genes (epha2a, sgk2b, foxo1a, and gadd45ga). Statistical significance was evaluated using unpaired t-test. *p < 0.05, **p < 0.01, and ***p < 0.001. Error bars represent ± standard error of the mean (SEM, n = 3). See section “Materials and Methods” for the definition of DEGs covered in X and Y comparisons.

Acknowledgments
This image is the copyrighted work of the attributed author or publisher, and ZFIN has permission only to display this image to its users. Additional permissions should be obtained from the applicable author or publisher of the image. Full text @ Front Cell Dev Biol