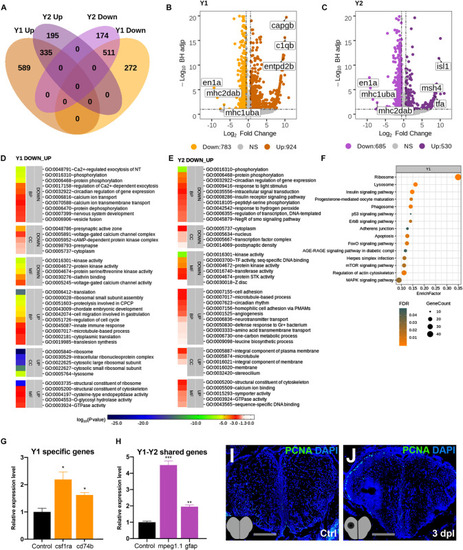
Transcriptome profiling of the telencephalon during the early proliferative stage of regeneration. (A) The Venn diagram shows the number of upregulated (Up) or downregulated (Down) differentially expressed genes (DEGs) in the lesioned (Y1, orange) and unlesioned (Y2, purple) hemispheres and the overlap between each set of DEGs at 3 dpl. A total of 1,707 and 1,215 genes were significantly changed in Y1 and Y2, respectively. There were 846 genes shared between Y1 and Y2. (B,C) Volcano plots representing changes in the gene expression levels in Y1 and Y2. Each point represents a gene. The X-axis shows log2 of fold change in the condition compared to the control and dashed vertical lines indicate the fold change cutoff. The Y-axis represents -log10 of the Benjamini–Hochberg adjusted p-value, where the significance threshold is indicated by the dashed horizontal line. Number of upregulated genes in Y1 and Y2: 924 and 530, respectively, and downregulated genes in Y1 and Y2: 783 and 685, respectively. Darker and lighter shades in (A–C) indicate upregulation and downregulation, respectively. (D,E) DAVID bioinformatics tool was used to show the most significantly enriched GO terms based on the transcriptional changes in Y1 and Y2 comparisons. The heatmap scale shows log10 of the EASE p-value for the most significantly enriched GO terms. (F) STRING bioinformatics tool was used to show the most significantly enriched KEGG pathways based on the transcriptional changes in X1 and X2. The dot plot represents KEGG pathways enriched in X1 and X2 by using all significantly changed genes in these comparisons based on FDR and EnrichFactor. (G,H) Relative expression levels of Y1-specific genes (csf1ra and cd74b) and the genes shared between Y1 and Y2 (mpeg1.1 and gfap). Statistical significance was evaluated using unpaired t-test. *p < 0.05, **p < 0.01, and ***p < 0.001. Error bars represent ± standard error of the mean (SEM, n = 3). (I,J) Anti-PCNA staining of the control and 3 dpl brain sections. Sections are counterstained for DAPI. DAVID, Database for Annotation, Visualization and Integrated Discovery; GO, Gene Ontology; BP, biological process; CC, cellular component; MF, molecular function; STRING, Search Tool for the Retrieval of Interacting Genes/Proteins; KEGG, Kyoto Encyclopedia of Genes and Genomes; FDR, false discovery rate; dpl, days post-lesion. See section “Materials and Methods” for the definition of DEGs covered in X and Y comparisons.
|
