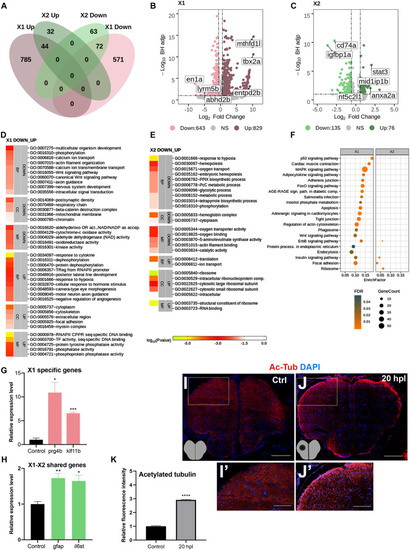
Transcriptome profiling of the telencephalon during the early wound healing stage of regeneration. (A) The Venn diagram shows the number of upregulated (Up) or downregulated (Down) differentially expressed genes (DEGs) in the lesioned (X1, pink) and unlesioned (X2, green) hemispheres and the overlap between each set of DEGs at 20 hpl. A total of 1,472 and 211 genes were significantly changed in X1 and X2, respectively. There were 116 genes shared between X1 and X2. (B,C) Volcano plots representing changes in the gene expression levels in X1 and X2. Each point represents a gene. The X-axis shows log2 of fold change in the condition compared to control and the vertical dashed lines indicate the fold change cutoffs. The Y-axis represents -log10 of the Benjamini–Hochberg adjusted p-value, where the significance threshold is indicated by the dashed horizontal line. Number of upregulated genes in X1 and X2: 829 and 76, respectively, and downregulated genes in X1 and X2: 643 and 135, respectively. Darker and lighter shades in (A–C) indicate upregulation and downregulation, respectively. (D,E) DAVID bioinformatics tool was used to show the most significantly enriched GO terms based on the transcriptional changes in X1 and X2 comparisons. The heatmap scale shows log10 of the EASE p-value for the most significantly enriched GO terms. (F) STRING bioinformatics tool was used to show the most significantly enriched KEGG pathways based on the transcriptional changes in X1 and X2. The dot plot represents KEGG pathways enriched in X1 and X2 by using all significantly changed genes in these comparisons based on FDR and EnrichFactor. (G,H) Relative expression levels of X1-specific genes (prg4b and klf11b) and the genes shared between X1 and X2 (gfap and il6st). Statistical significance was evaluated using unpaired t-test. *p < 0.05, **p < 0.01, and ***p < 0.001. Error bars represent ± standard error of the mean (SEM, n = 3). (I–I′,J–J′) Anti-acetylated tubulin staining of the control and 20 hpl brain sections with boxed areas magnified. Sections are counterstained for DAPI. Scale bars, 200 μm in (I,J); 100 μm in (I′) and (J′). (K) Relative fluorescence intensity in brain sections stained for anti-acetylated tubulin. DAVID, Database for Annotation, Visualization and Integrated Discovery; GO, Gene Ontology; BP, biological process; CC, cellular component; MF, molecular function; STRING, Search Tool for the Retrieval of Interacting Genes/Proteins; KEGG, Kyoto Encyclopedia of Genes and Genomes; FDR, false discovery rate; hpl, hours post-lesion. See section “Materials and Methods” for the definition of DEGs covered in X and Y comparisons. *p < 0.05, **p < 0.01, ***p < 0.001, and ****p < 0.0001.
|
