IMAGE

FIGURE 6

ID
ZDB-IMAGE-201121-128
Source
Figures for Demirci et al., 2020
Image
Figure Caption

FIGURE 6

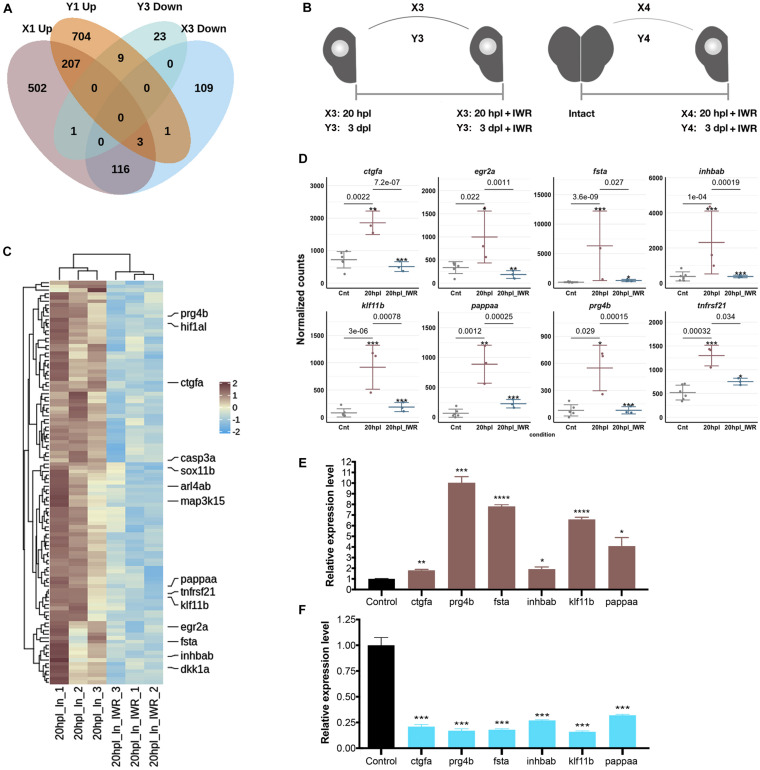
Inhibition of Wnt/β-catenin signaling during the early wound healing stage identifies 119 target genes that are positively regulated by the pathway. (A) The Venn diagram shows the number of differentially expressed genes (DEGs) that are upregulated (Up) in the lesioned 20-hpl (X1, dark pink), downregulated (Down) in the lesioned + IWR-1-treated 20-hpl (X3, light blue), Up in the lesioned 3-dpl (Y1, dark orange), or Down in the lesioned + IWR-1-treated 3-dpl (Y3, turquoise) hemispheres and the overlap between each set of DEGs. There were 119 genes Up in X1 and Down in X3, while only nine genes were Up in Y1 and Down in Y3. (B) Preparation of RNA samples from the lesioned hemisphere at 20 hpl or 3 dpl. X3: 20-hpl lesioned hemisphere after IWR treatment vs. 20-hpl lesioned hemisphere; Y3: 3-dpl lesioned hemisphere after IWR treatment vs. 3-dpl lesioned hemisphere; X4: 20-hpl lesioned hemisphere after IWR treatment vs. control; Y4: 3-dpl lesioned hemisphere after IWR treatment vs. control. (C) The heatmap shows the Wnt target genes that are Up in X1 and Down in X3. Each column represents a single hemisphere from a single telencephalon and each row shows a single gene. The scale bar shows counts Z-scores from high to low expression, represented by a color gradient from orange to green, respectively. (D) Dot plot representation of normalized transformed read counts of a representative set of Wnt target genes that are Up in X1 and Down in X3 (brown: 20-hpl lesioned hemispheres; blue: 20-hpl lesioned + IWR-1-treated hemispheres). The mean ± standard deviations (SD) of three independent experiments are plotted. (E,F) Relative expression levels of the Wnt target genes that are Up in X1 and Down in X3 (ctgfa, prg4b, fsta, inhbab, klf11b, and pappaa). Statistical significance was evaluated using unpaired t-test. *p < 0.05, **p < 0.01, ***p < 0.001, and ****p < 0.0001. Error bars represent ± standard error of the mean (SEM, n = 3). See section “Materials and Methods” for the definition of DEGs covered in X and Y comparisons.

Acknowledgments
This image is the copyrighted work of the attributed author or publisher, and ZFIN has permission only to display this image to its users. Additional permissions should be obtained from the applicable author or publisher of the image. Full text @ Front Cell Dev Biol