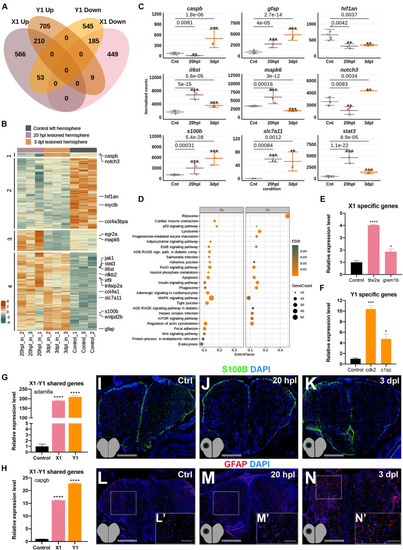
Early wound healing and proliferative stages of brain regeneration are more different than similar. (A) The Venn diagram shows the number of upregulated (Up) or downregulated (Down) differentially expressed genes (DEGs) in the lesioned 20-hpl (X1, pink) and lesioned 3-dpl (Y1, orange) hemispheres and the overlap between each set of DEGs. Out of 1,472 genes, 1,015 were significantly changed only in X1, while 1,250 out of 1,707 genes were so in Y1. There were 457 genes shared between X1 and Y1. Darker and lighter shades indicate upregulation and downregulation, respectively. (B) The heatmap shows the expressions of genes shared between X1 and Y1. Each column represents a single hemisphere from a single telencephalon and each row shows a single gene. The scale bar shows counts Z-scores from high to low expression, represented by a color gradient from orange to green, respectively. (C) Dot plot representation of normalized transformed read counts of a representative set of genes shared between X1 and Y1 (gray: control samples; pink: 20-hpl lesioned hemisphere; orange: 3 dpl lesioned hemisphere). The mean ± standard deviations (SD) of three independent experiments are plotted. (D) STRING bioinformatics tool was used to show the most significantly enriched KEGG pathways based on the transcriptional changes in X1 and X2. The dot plot represents KEGG pathways enriched in X1 and Y1 by using all significantly changed genes in these comparisons based on FDR and EnrichFactor. (E,F) Relative expression levels of DEGs that are unique to X1 (tbx2a and grem1b) or unique to Y1 (cdk2 and c1qc). (G,H) Relative expression levels of DEGs shared between X1 and Y1 (adam8a and capgb). Statistical significance was evaluated using unpaired t-test. ****p < 0.0001. Error bars represent ± standard error of the mean (SEM, n = 3). (I–K) Anti-S100β staining of the control, 20 hpl, and 3 dpl brain sections. (L–N,L′–N′) Anti-GFAP staining of the control, 20 hpl, and 3 dpl brain sections with boxed areas magnified. Sections are counterstained for DAPI. Scale bars, 200 μm in (L–N); 100 μm in (L′–N′). STRING, Search Tool for the Retrieval of Interacting Genes/Proteins; KEGG, Kyoto Encyclopedia of Genes and Genomes; FDR, false discovery rate; hpl, hours post-lesion; dpl, days post-lesion. See section “Materials and Methods” for the definition of DEGs covered in X and Y comparisons. *p < 0.05, **p < 0.01, ***p < 0.001, and ****p < 0.0001.
|
