
- Title
-
Tdrd6a Regulates the Aggregation of Buc into Functional Subcellular Compartments that Drive Germ Cell Specification
- Authors
- Roovers, E.F., Kaaij, L.J.T., Redl, S., Bronkhorst, A.W., Wiebrands, K., de Jesus Domingues, A.M., Huang, H.Y., Han, C.T., Riemer, S., Dosch, R., Salvenmoser, W., Grün, D., Butter, F., van Oudenaarden, A., Ketting, R.F.
- Source
- Full text @ Dev. Cell
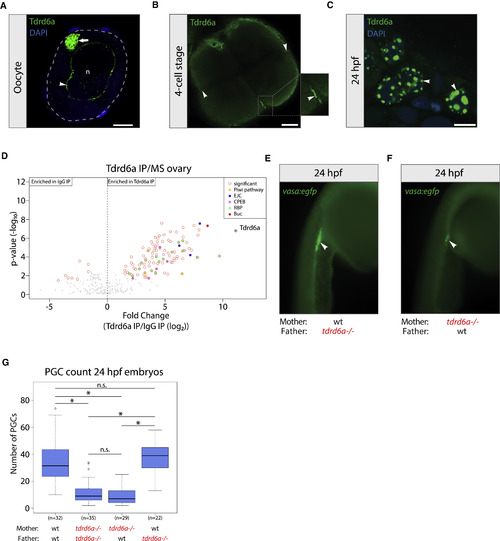
Tdrd6a Is Germline Specific and Required for PGC Formation (A) IHC for Tdrd6a in oocytes. Arrowhead and arrow indicate Tdrd6a staining in the nuage and Bb, respectively. Gray dashed line outlines the cell, n = nucleus. Scale bar, 10 μm. (B) IHC for Tdrd6a in 4-cell stage embryos. Arrows indicate Tdrd6a localization to the Gp. Scale bar, 100 μm. (C) Tdrd6a localizes to peri-nuclear nuage granules (arrowheads) in PGCs at 24 hpf. Scale bar, 7.5 μm. (D) MS of Tdrd6a IPs on an ovary, compared to IgG (immunoglobulin G) control. (E and F) 24 hpf embryos derived from wt (E) or tdrd6a mutant mothers (F) in a vasa:egfp background. Arrowheads indicate the PGCs. (G) Quantification of PGC numbers in 24 hpf embryos from the crosses indicated on the x axis (∗ indicates p value < 0.0001, n.s. = non-significant, calculated by Wilcoxon test). See also Figures S1 and S2. |

ZFIN is incorporating published figure images and captions as part of an ongoing project. Figures from some publications have not yet been curated, or are not available for display because of copyright restrictions. PHENOTYPE:
|
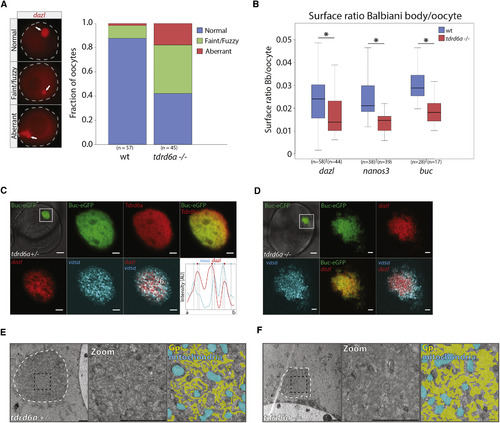
Tdrd6a Is Required for Bb Integrity (A) Quantification of Bb phenotypes as indicated based on dazl FISH on oocytes (examples indicated on the left, arrows indicate Bb). (B) Surface ratio of Bbs in wt versus tdrd6a mutant oocytes (∗ indicates p value < 0.001, Wilcoxon test). (C and D) Confocal images of Buc-eGFP-positive oocytes in tdrd6a+/− (C) and tdrd6a−/− (D) background. IHC for Tdrd6a and double smFISH was performed and displayed as indicated. Dazl and vasa signals typically do not overlap, illustrated in the line graph. Intensity for dazl (red) and vasa (cyan) signals over line a-b (see overlay), with vertical lines indicating fluorescence peaks per smFISH signal (highlighted by colored circle on top) showing transcript peaks are in a separate phase. (E and F) Electron micrographs of Bbs of tdrd6a+/− (E) and tdrd6a−/− (F) oocytes (white dashed line). The zoom (black dashed square) is shown with (right) and without (middle) overlays that mark the Gp (yellow) and mitochondria (cyan). Scale bars, 10 μm (overview C and D), 2 μm (zoom) (C and D), and 2 μm (E and F). See also Figure S4. |

Tdrd6a Is Required for Gp Integrity (A) Confocal images of Buc-eGFP-positive embryos from tdrd6a+/− mothers, at 1-, 2-, and 4-cell stages, focusing on Gp as schematically indicated. In zoom of the Gp, IHC for Tdrd6a and double smFISH was performed and displayed as indicated. Arrowheads indicate mRNA and Tdrd6a that is peripherally localized on the Gp granule; arrows indicate Buc-eGFP bridges (zooms 1 and 2 on the right). Asterisks mark mature Gp, containing fused Buc-eGFP and mRNA networks inside the structure. Line graphs display intensity for Buc (green) versus Tdrd6a (red) signals over line a-b and dazl (red) versus vasa (cyan) intensity over line c-d, with vertical lines indicating fluorescence peaks per smFISH signal (highlighted by colored circle on top). (B) Confocal images of Buc-eGFP-positive Gp of a 4-cell stage embryo from a tdrd6a−/− mother (Mmut). SmFISH was performed and displayed as indicated. Arrows indicate areas where Buc-eGFP has fused, but mRNA remains peripherally localized. (C) Boxplot representing volumes of the Buc-eGFP signal at the cleavage planes of wt and Mmut 4-cell stage embryos. The largest Gp fragment of each embryo was measured (also see Figure S5B) after 3D reconstruction in Imaris. (∗ indicates p value < 0.001, Wilcoxon test). (D) Quantification of Gp phenotypes of 4-cell stage embryos using an ISH against vasa. Scale bars, 10 μm (overview A), 2 μm (zoom) (A), and 2 μm (B). See also Figure S5. |
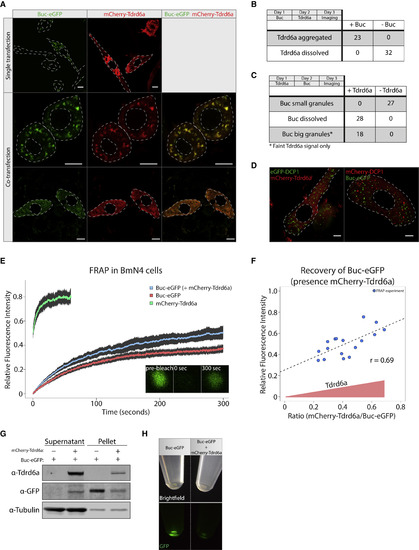
Tdrd6a Stimulates Buc Mobility in BmN4 Cells (A) Localization of Buc-eGFP and mCherry-Tdrd6a in BmN4 cells in a single transfection (upper panel) and when they are co-transfected (middle and bottom). Co-transfected BmN4 cells displaying enlarged Buc-eGFP granules to which mCherry-Tdrd6a co-localizes (middle) or dissolved Buc-eGFP (bottom). Scale bars, 10 μm. (B) Quantification of localization of Tdrd6a transfected 1 day after Buc. (C) Quantification of localization of Buc transfected 1 day after Tdrd6a. (D) Co-transfection of Dcp1-mCherry with Buc-eGFP (left) or Dcp1-eGFP with mCherry-Tdrd6a (right). Scale bars, 5 μm. (E) FRAP recovery curves of mCherry-Tdrd6a and Buc-eGFP (with or without the presence of mCherry-Tdrd6a as indicated). Fluorescence intensity is the calculated fraction of the pre-bleach intensity and is plotted with the 95% confidence interval. (F) FRAP recovery of Buc-eGFP plotted against increasing relative amounts of mCherry-Tdrd6a present in the bleached granule. (G) Western blot for GFP and Tdrd6a on transfected BmN4 cell lysates and corresponding pellets. (H) Pellets of lysates of Buc-EGFP-expressing BmN4 cells in the presence or absence of Tdrd6a as indicated. See also Figure S6. |
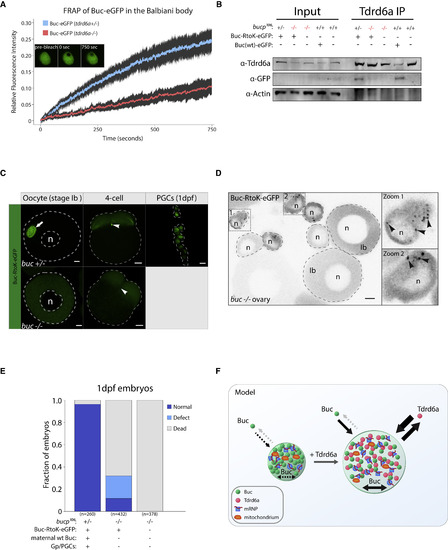
Tdrd6a Stimulates Buc-eGFP Mobility In Vivo (A) FRAP recovery curves of Buc-eGFP in tdrd6a heterozygous or mutant Balbiani bodies. Fluorescence intensity is the calculated fraction of the pre-bleach intensity and plotted with a 95% confidence interval. (B) Tdrd6a IPs probed for the indicated proteins by western blot. Bucp106 = buc loss-of-function allele. Note that Buc-eGFP is typically very hard to detect in total lysates. (C) Localization of Buc-RtoK-eGFP in the buc+/− and buc−/− background. Arrow indicates Bb, arrowheads indicate Gp (buc+/−) or where Gp should be (buc−/−). Scale bars for oocyte and 1dpf, 10 μm. Scale bar for 4-cell, 100 μm. n = nucleus. (D) Overview of buc−/− ovary (whole mount) positive for Buc-RtoK-eGFP. Zooms 1 and 2 are examples of stage-I oocytes ø < ∼30 μm, containing small Buc-RtoK-positive granules (arrowheads). These granules are never detected in stage-Ib oocytes, where Buc-RtoK is diffusely cytoplasmic. Scale bar, 10 μm, n = nucleus. (E) Quantification of progeny viability at 1 dpf spawned by mothers with background as indicated, crossed with wt males. (F) Model of Buc-containing granules, with or without Tdrd6a. Arrows indicate movement in and out of the structure or mobility within the structure itself. See also Figure S7. |
Reprinted from Developmental Cell, 46, Roovers, E.F., Kaaij, L.J.T., Redl, S., Bronkhorst, A.W., Wiebrands, K., de Jesus Domingues, A.M., Huang, H.Y., Han, C.T., Riemer, S., Dosch, R., Salvenmoser, W., Grün, D., Butter, F., van Oudenaarden, A., Ketting, R.F., Tdrd6a Regulates the Aggregation of Buc into Functional Subcellular Compartments that Drive Germ Cell Specification, 285-301.e9, Copyright (2018) with permission from Elsevier. Full text @ Dev. Cell