
- Title
-
Directing Nanoparticle Biodistribution Through Evasion and Exploitation of Stab2-Dependent Nanoparticle Uptake
- Authors
- Campbell, F., Bos, F.L., Sieber, S., Arias-Alpizar, G., Koch, B.E., Huwyler, J., Kros, A., Bussmann, J.
- Source
- Full text @ ACS Nano

A zebrafish model for liposome biodistribution. (a) Schematic of liposome injection and quantification in zebrafish. Fluorescently labeled liposomes (1 mM total lipids containing 1 mol % Rhod-PE) were injected into the duct of Cuvier at 54 hpf. Confocal microscopy is performed in a defined region (boxed) caudal to the yolk extension at 1, 8, 24, and 48 h after injection. (b) Whole-embryo view of liposome distribution in kdrl:GFP transgenic embryos, 1 hpi with three different liposome formulations (AmBisome, EndoTAG-1, and Myocet). (c) High-resolution imaging allows quantification of liposomes in circulation (measured in the lumen of the dorsal aorta (white box)) and liposome association with different blood vessel types (see Supporting Information). CHT-EC: caudal hematopoietic tissue endothelial cells, DLAV: dorsal longitudinal anastomotic vessel. ISV: intersegmental vessel. (d) Tissue level view of liposome distribution in kdrl:gfp transgenic embryos, 1 h and 8 h after injection with three different liposome formulations and a single confocal section through the dorsal aorta (DA) at 1 h after injection. (e) Quantification of liposome levels in circulation based on mean rhodamine fluorescence intensity in the lumen of the dorsal aorta at 1, 8, 24, and 48 h after injection (error bars: standard deviation.) n = 6 individually injected embryos per formulation per time point (in two experiments). (f) Quantification of liposome levels associated with venous vs arterial endothelial cells based on rhodamine fluorescence intensity associated with caudal vein (CV) vs DA at 8 h after injection. (g) Quantification of extravascular liposome levels based on rhodamine fluorescence intensity outside of the vasculature between the DLAV and DA at 8 h after injection. (h) Quantification of liposome levels associated with the vessel wall based on rhodamine fluorescence intensity associated with all endothelial cells relative to rhodamine fluorescence intensity in circulation at 1h after injection. (f–h) Bar height represents median values, dots represent individual data points, brackets indicate significantly different values (*: p < 0.05, **: p < 0.01, ***: p < 0.001) based on Kruskal–Wallis and Dunn’s tests with Bonferroni correction for multiple testing. n = 12 individually injected embryos per group (in 2 experiments). (i) Whole-embryo view of liposome distribution in kdrl:GFP transgenic embryos, 1 h after injection with DOPG and DSPC liposomes. Liposome accumulation for both formulations is observed in the primitive head sinus (PHS), common cardinal vein (CCV), posterior cardinal vein (PCV), and caudal vein (CV). (j) Tissue level view of liposome distribution in kdrl:GFP transgenic embryos, 1 h after injection with DOPG and DSPC liposomes at 102 hpf. Liposome accumulation is observed in the entire caudal vein (CV), but only on the dorsal side of the PCV (dPCV, arrows). |
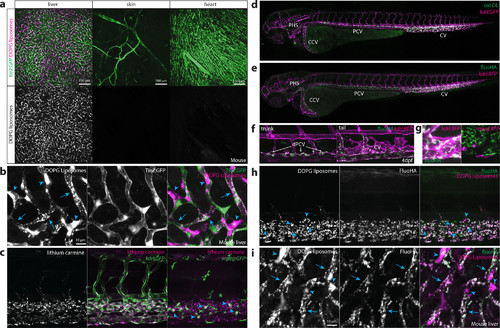
Identification of scavenger endothelial cells (SECs) in zebrafish embryos. (a, b) Ex vivo imaging of adult Tie2:GFP transgenic mouse organs, 1 h after injection with DOPG liposomes. (a) Liposome accumulation is observed in liver, but not in the ear skin or heart muscle. (b) Within the liver, DOPG liposomes are observed as punctae within Tie2:GFP+ sinusoidal ECs (arrows) as well as sinusoid-associated cells which based on shape and position were identified as KCs (arrowheads). (c) Tissue level view of lithium carmine distribution in kdrl:GFP and mpeg:GFP transgenic zebrafish embryos, 1 h after injection. Lithium carmine (carminic acid) fluorescence co-localizes both with kdrl:GFP+ endothelial cells in the caudal vein and mpeg:GFP+ monocytes/macrophages (arrowheads) within the CHT. (d) Whole-embryo view of fluorescent oxLDL distribution in kdrl:GFP transgenic embryos, 1 h after injection. Accumulation of oxLDL is observed in the PHS, CCV, PCV, and CV. (e) Whole-embryo view of fluoHA distribution in kdrl:RFP transgenic embryos, 1 h after injection. Accumulation of fluoHA is observed in the PHS, CCV, PCV, and CV. (f) Tissue level view of fluoHA distribution in kdrl:RFP transgenic embryos, 1 h after injection at 102 hpf. FluoHA accumulation is observed in the entire caudal vein (CV), but only on the dorsal side of the PCV (dPCV, arrows). (g) Tissue level view of fluoHA in kdrl:RFP and mpeg:RFP transgenic embryos. Co-localization of RFP expression and fluoHA is observed only within kdrl:RFP endothelial cells, but not mpeg:RFP monocytes/macrophages. (h) Tissue level view of co-injected fluoHA and DOPG liposomes, 1 h after injection reveals co-localization in SECs. Monocytes/macrophages (arrowheads) take up DOPG but not fluoHA. (i) Ex vivo imaging of adult mouse liver, 1 h after injection with fluoHA and DOPG liposomes reveals widespread co-localization within sinusoidal ECs (arrows). KCs (arrowheads) take up DOPG liposomes only. |
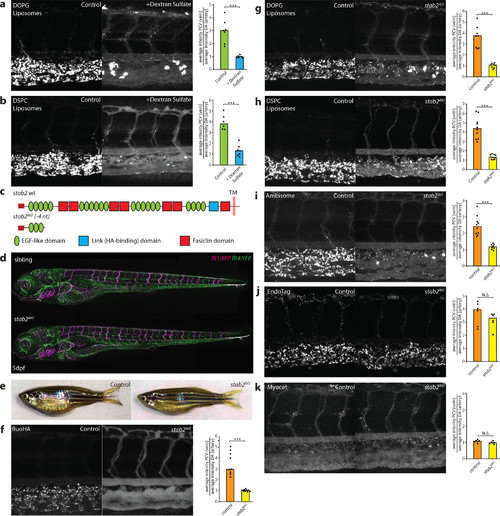
stab2 is required for anionic liposome uptake by SECs. (a, b) Tissue level view of DOPG (a) and DSPC (b) liposome distribution at 1 hpi in control and dextran sulfate injected embryos, with quantification of liposome levels associated with venous vs arterial endothelial cells based on rhodamine fluorescence intensity associated with CV vs DA. (c) stab2 domain structure predicted to be expressed from the wild-type stab2 and the stab2ibl2 allele. (d) Whole-embryo view of flt1:RFP, flt4:YFP double transgenic embryos at 5 dpf to visualize blood vascular and lymphatic development. No defects were identified during (lymph)angiogenesis and vascular patterning in stab2ibl2 homozygous embryos compared to sibling controls. (e) Fertile adult females (stab2ibl2 homozygous and sibling controls) at 3 months post-fertilization. (f–k) Tissue level view of fluoHA (f) and DOPG (g), DSPC (h), AmBisome (i), EndoTAG-1 (j), and Myocet (k) liposome distribution at 1 hpi in stab2ibl2 and sibling control embryos, with quantification of liposome levels associated with venous vs arterial endothelial cells based on rhodamine fluorescence intensity associated with CV vs DA. (a, b, f–k) Bar height represents median values, dots represent individual data points, and brackets indicate significantly different values (*: p < 0.05, **: p < 0.01, ***: p < 0.001, N.S.: not significant) based on Mann–Whitney test. n = 6–10 per group (in two experiments). |
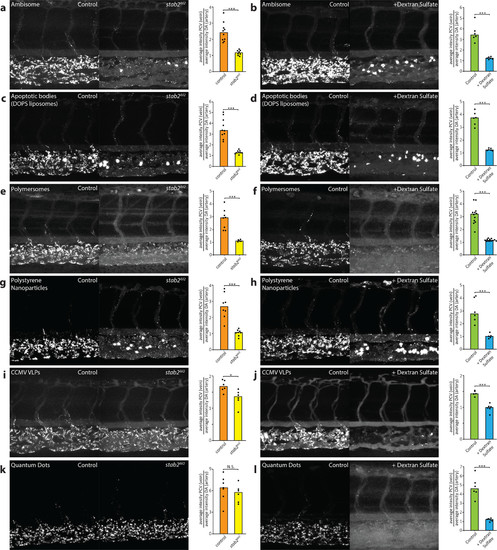
stab2-mediated scavenging of anionic nanoparticles in vivo. (a–i) Tissue level view of DOPS liposome (a, b), PIB-PEG polymersome (c, d), carboxylated polystyrene nanoparticle (e, f), CCMV virus-like particle (g, h), and carboxylated quantum dot (i, j) distribution at 1 hpi in stab2ibl2 and sibling control embryos (a, c, e, g, i) or control and dextran sulfate injected embryos (b, d, f, h, j). Quantification of nanoparticle levels associated with venous vs arterial endothelial cells based on rhodamine fluorescence intensity associated with caudal vein vs DA. (a–j) Bar height represents median values, dots represent individual data points, and brackets indicate significantly different values (*: p < 0.05, **: p < 0.01, ***: p < 0.001, N.S.: not significant) based on Mann–Whitney test. n = 5–12 per group (in two experiments). PHENOTYPE:
|
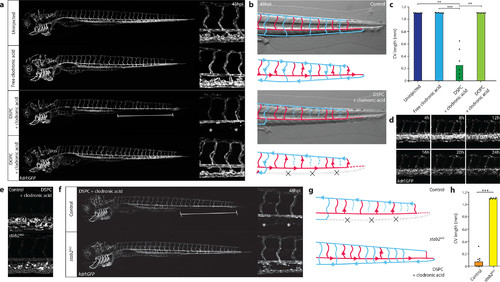
Nanoparticle-mediated SEC deletion. (a) Whole-embryo and tissue level views at 48 hpi of the blood vasculature in kdrl:GFP transgenic control embryos, embryos injected with 1 mg/mL clodronic acid, or embryos injected with liposomes containing 1 mg/mL clodronic acid (DSPC or DOPC liposomes). Complete deletion of the caudal vein is observed in embryos injected with DSPC liposomes containing clodronic acid (brackets and asterisks). (b) Schematic representation of blood flow in control embryos or embryos injected with DSPC liposomes containing 1 mg/mL clodronic acid. Blue indicates venous or capillary blood vessels, and red indicates arterial blood vessels. Arrowheads indicate direction of blood flow (based on observations from Movie S1). The removal of the CV (dashed lines) leads to a rerouting of blood flow through the DLAV. (c) Quantification of PCV length in injected embryos. Bar height represents median values, dots represent individual data points, and brackets indicate significant values (**: p < 0.01, ***: p < 0.001) based on Kruskal–Wallis and Dunn’s tests with Bonferroni correction for multiple testing. n = 6 individually injected embryos per group (in two experiments). (d) Progression of SEC deletion. Individual frames from Movie S2 at indicated time points after injection of DSPC liposomes containing 1 mg/mL clodronic acid, injected into kdrl:GFP transgenic embryos. SEC fragmentation in this case is observed mostly between 12 hpi and 16 hpi, followed by a gradual loss of fluorescence or removal of cellular debris. (e) Tissue level view of distribution of DSPC liposomes containing 1 mg/mL clodronic acid at 1 hpi in stab2ibl2 and sibling control embryos. (f) Whole-embryo and tissue level views at 48 hpi of the blood vasculature in kdrl:GFP transgenic stab2ibl2 and sibling embryos. Embryos were injected with DSPC liposomes containing 1 mg/mL clodronic acid. Complete deletion of the caudal vein is observed in sibling control (brackets and asterisks), but not stab2ibl2 mutant embryos. (g) Schematic representation of blood flow in sibling control embryos or stab2ibl2 homozygous mutants, both injected with DSPC liposomes containing approximately 1 mg/mL clodronic acid. Blue indicates venous or capillary blood vessels, and red indicates arterial blood vessels. Arrowheads indicate direction of blood flow (based on observations from Movie S3). The removal of the CV (dashed lines) leads to a rerouting of blood flow through the DLAV in control embryos but not in stab2ibl2 homozygous mutants. (h) Quantification of PCV length in injected embryos. Bar height represents median values, dots represent individual data points, and brackets indicate significant values (***: p < 0.001) based on Mann–Whitney test. PHENOTYPE:
|
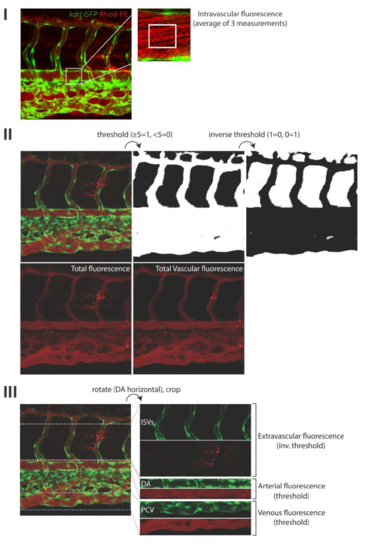
Overview of quantification method as described in the Materials & Methods section. I. Quantification of intravascular fluorescence (liposomes in circulation). II. Quantification of total and total vascular fluorescence. III. Quantification of arterial, venous and extravascular fluorescence. |

Size-dependent uptake of neutral liposomes by monocytes/macrophages. A. Whole-embryo and cellular views of liposome distribution in mpeg:GFP transgenic embryos, 2h after injection with Myocet liposomes ~100nm (with and without 10 mol% DOPE-mPEG2000), 325nm and 464nm pores. Immobile liposome aggregates were observed to colocalize with mpeg:gfp positive macrophages/monocytes within the caudal hematopoietic tissue (CHT). Fluorescence intensity was found to increase with increased liposome size, and phagocytosis could be prevented by PEGylation. B. High-resolution imaging shows intracellular localization of 400nm liposomes within macrophages/monocytes. |
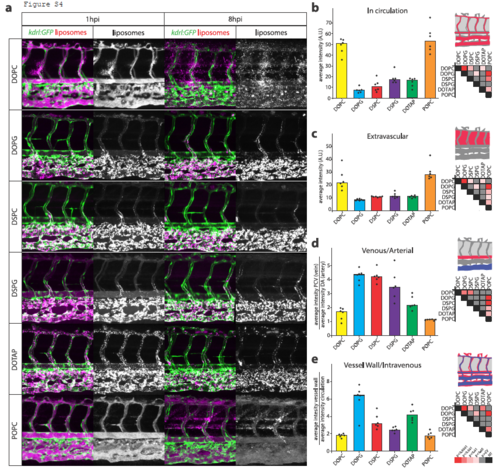
Contribution of individual lipids to liposome biodistribution. A. Cellular view of liposome distribution in kdrl:GFP transgenic embryos, 1h and 8h after injection with liposomes generated from six different individual lipids. B. Quantification of liposome levels in circulation based on rhodamine fluorescence intensity in the lumen of the dorsal aorta at 1h after injection. C. Quantification of extravascular liposome levels based on rhodamine fluorescence intensity outside of the vasculature between the DLAV and DA at 8h after injection. D. Quantification of liposome levels associated with venous vs. arterial endothelial cells based on rhodamine fluorescence intensity associated with caudal vein vs. DA at 8h after injection. E. Quantification of liposome levels associated with the vessel wall based on relative rhodamine fluorescence intensity associated with all endothelial cells vs. rhodamine fluorescence intensity in circulation at 1h after injection. BE. Bar height represents median values, dots represent individual data points, significantly different pairs of values based on Kruskal-Wallis and Dunn’s test with Bonferroni correction are indicated by colored boxes (representing significance levels; CV=critical value; NT=not tested). n=6 individually injected embryos per group (in 2 experiments). |
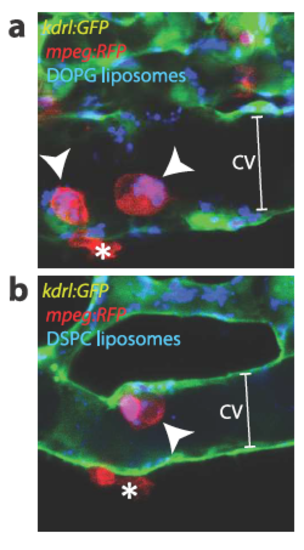
Macrophage uptake of DOPG and DSPC liposomes. Confocal micrographs of kdrl:GFP (green); mpeg:RFP (red) double transgenic embryos injected with DOPE-ATTO633 labeled DOPG (A) or DSPC (B) liposomes. Besides uptake of liposomes in caudal vein (CV, brackets) endothelial cells, uptake by plasma-exposed (arrowheads) but not extravascular (asterisks) macrophages/monocytes is also observed for both liposomes |

Expression of LSEC marker genes in zebrafish embryos A,B. Whole-mount in situ hybridization of stab1, stab2 and mrc1a mRNA. A. Whole-embryo view showing expression of these genes in the PHS, CCV, PCV and CV B. Higher-resolution image showing expression in the entire caudal vein, but only on the dorsal side of the PCV (arrows). EXPRESSION / LABELING:
|
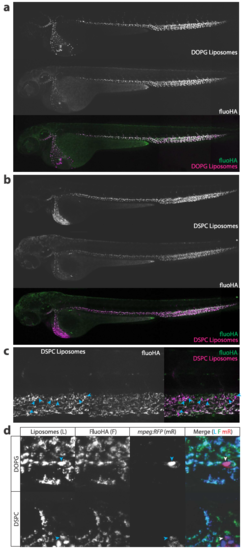
FluoHA colocalization with liposomes. A,B. Whole-embryo view of coinjected fluoHA (green) and A. DOPG liposomes or B. DSPC liposomes (red), 1h after injection, reveals colocalization in PHS, CCV, PCV and CV scavenger endothelial cells. C. Tissue level view of coinjected fluoHA and DOPG liposomes, 1h after injection reveals colocalization in SECs. Monocytes/macrophages (arrowheads) take up DSPC but not fluoHA. D. Cellular view of coinjected fluoHA (green) and DOPG or DSPC liposomes (blue) in mpeg:RFP (red) transgenic embryos. Colocalization of fluoHA with both liposomes is observed in all SECs, but not in macrophages/monocytes, which only take up liposomes, but not fluoHA. |

FluoHA distribution through embryonic development. A. Whole-embryo view of fluorescent hyaluronic acid (fluoHA) distribution in kdrl:RFP transgenic embryos, 1h after injection. SECs, as identified through intracellular accumulation of fluoHA from 28hpf to at least 128hpf. From 104hpf, fluoHA uptake is also observed in lymphatic vessels, such as the thoracic duct (TD) and facial lymphatics (FL) B. Cellular view of fluoHA distribution in the trunk of kdrl:RFP transgenic embryos, 1h after injection. A gradual restriction of fluoHA accumulation to the PCV is observed between 52hpf and 104hpf. |
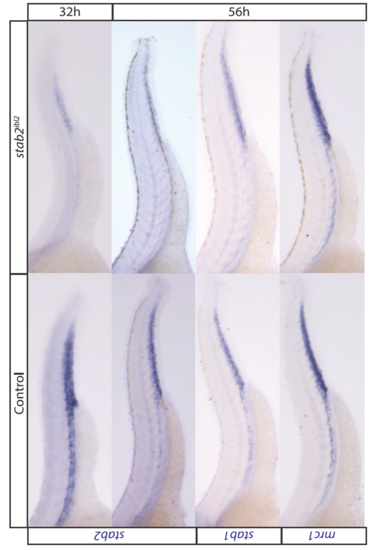
Gene expression in stab2ibl2 homozygous mutant embryos. Whole-mount in situ hybridization of stab1 and mrc1 mRNA expression at 56hpf and stab2 mRNA expression at 32hpf and 56hpf in the trunk and tail of stab2ibl2 homozyogous mutant and sibling control embryos. A reduction in stab2 expression indicating nonsense-mediated decay of the stab2ibl2 mRNA is observed stab2ibl2 homozygous, but not sibling control embryos. Expression of stab1 and mrc1 is unchanged indicating normal SEC differentiation. |
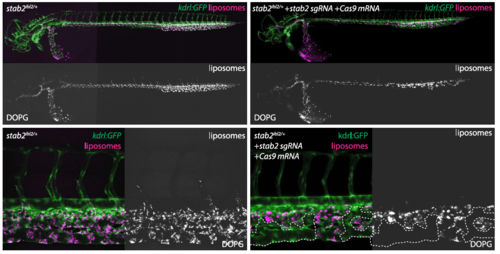
Clonal stab2 deletion. Whole-embryo and cellular views of DOPG liposome distribution in stab2ibl2/+; kdrl:GFP+ embryos. CRISPR/Cas9 introduced mutations in the wildtype allele generated clones of cells without stab2 function. In stab2 sgRNA and Cas9 mRNA injected, but not control embryos, endothelial cell clones are observed in which DOPG accumulation is abrogated, indicating a requirement for stab2 function within SECs. |

Cell-type selectivity of DSPC-clodronic acid liposomes. Confocal imaging of mpeg:GFP (macrophage/monocytes) and mpx:GFP (neutrophil) transgenic zebrafish embryos 48h after injection with 1nl of DSPC-clodronic acid liposomes (10mM total lipids) showing normal development of these lineages in the tail of injected embryos compared to uninjected controls (UIC). |