
|
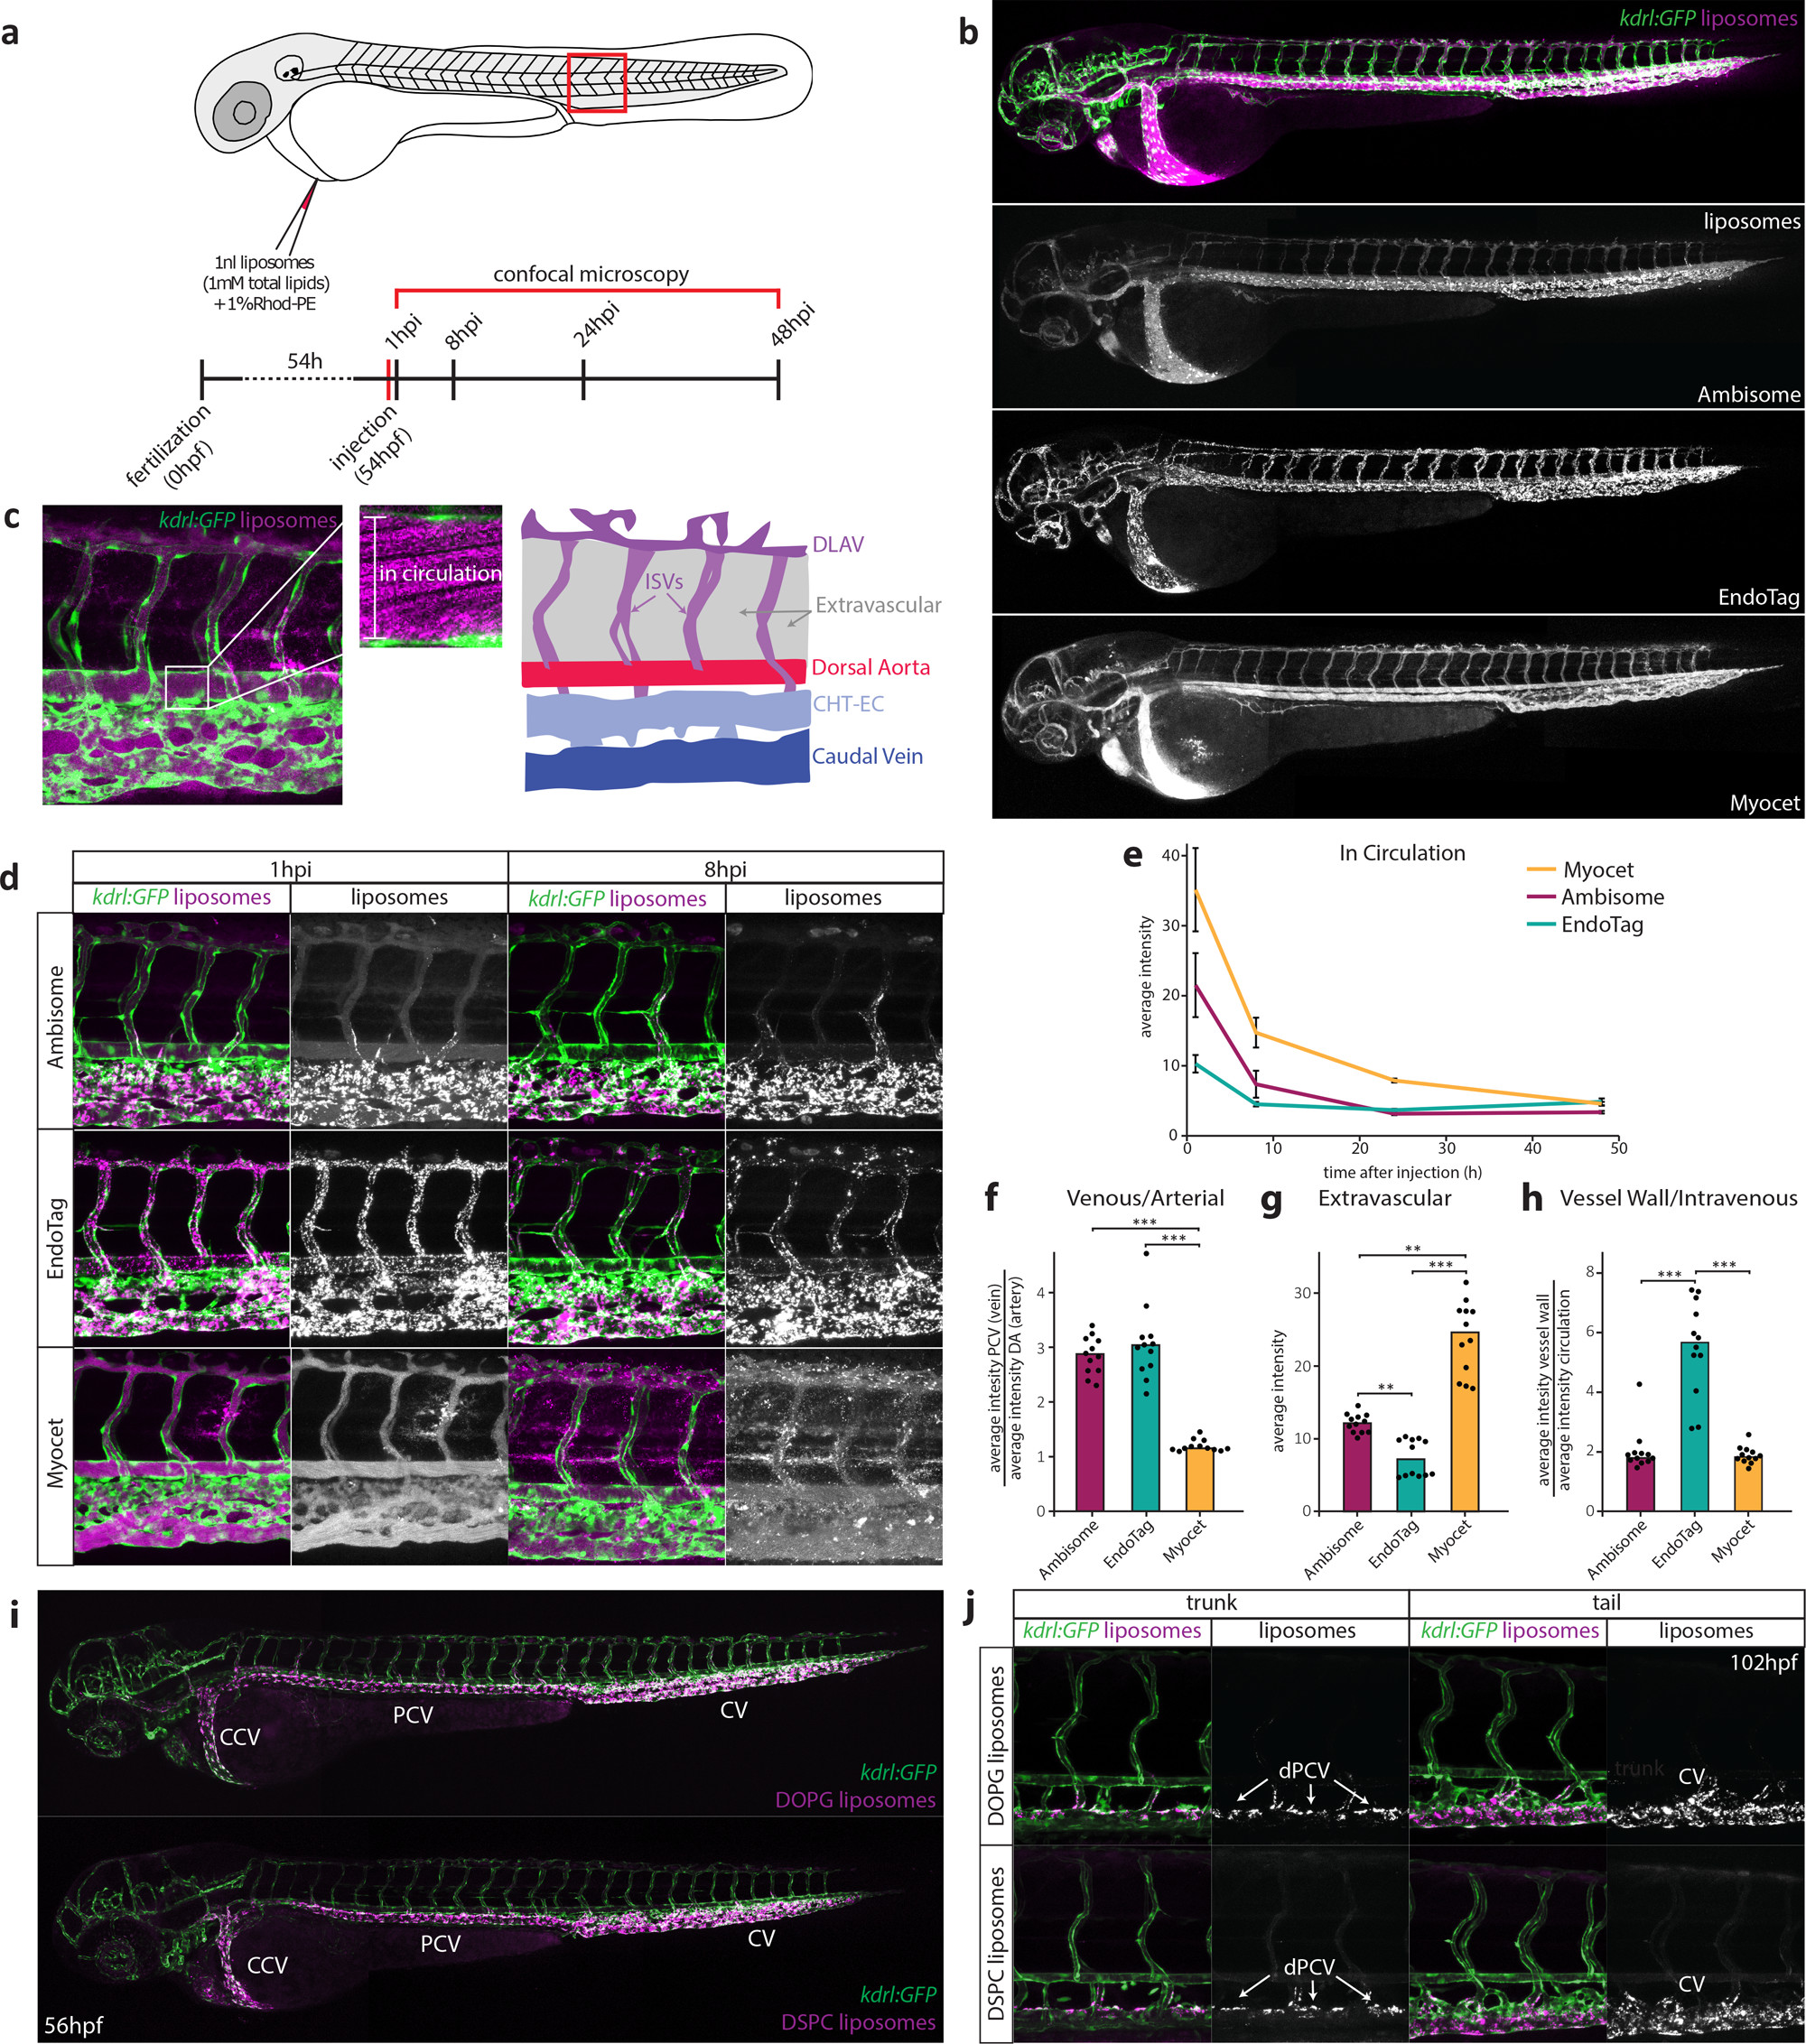
Fig. 1
A zebrafish model for liposome biodistribution. (a) Schematic of liposome injection and quantification in zebrafish. Fluorescently labeled liposomes (1 mM total lipids containing 1 mol % Rhod-PE) were injected into the duct of Cuvier at 54 hpf. Confocal microscopy is performed in a defined region (boxed) caudal to the yolk extension at 1, 8, 24, and 48 h after injection. (b) Whole-embryo view of liposome distribution in kdrl:GFP transgenic embryos, 1 hpi with three different liposome formulations (AmBisome, EndoTAG-1, and Myocet). (c) High-resolution imaging allows quantification of liposomes in circulation (measured in the lumen of the dorsal aorta (white box)) and liposome association with different blood vessel types (see Supporting Information). CHT-EC: caudal hematopoietic tissue endothelial cells, DLAV: dorsal longitudinal anastomotic vessel. ISV: intersegmental vessel. (d) Tissue level view of liposome distribution in kdrl:gfp transgenic embryos, 1 h and 8 h after injection with three different liposome formulations and a single confocal section through the dorsal aorta (DA) at 1 h after injection. (e) Quantification of liposome levels in circulation based on mean rhodamine fluorescence intensity in the lumen of the dorsal aorta at 1, 8, 24, and 48 h after injection (error bars: standard deviation.) n = 6 individually injected embryos per formulation per time point (in two experiments). (f) Quantification of liposome levels associated with venous vs arterial endothelial cells based on rhodamine fluorescence intensity associated with caudal vein (CV) vs DA at 8 h after injection. (g) Quantification of extravascular liposome levels based on rhodamine fluorescence intensity outside of the vasculature between the DLAV and DA at 8 h after injection. (h) Quantification of liposome levels associated with the vessel wall based on rhodamine fluorescence intensity associated with all endothelial cells relative to rhodamine fluorescence intensity in circulation at 1h after injection. (f–h) Bar height represents median values, dots represent individual data points, brackets indicate significantly different values (*: p < 0.05, **: p < 0.01, ***: p < 0.001) based on Kruskal–Wallis and Dunn’s tests with Bonferroni correction for multiple testing. n = 12 individually injected embryos per group (in 2 experiments). (i) Whole-embryo view of liposome distribution in kdrl:GFP transgenic embryos, 1 h after injection with DOPG and DSPC liposomes. Liposome accumulation for both formulations is observed in the primitive head sinus (PHS), common cardinal vein (CCV), posterior cardinal vein (PCV), and caudal vein (CV). (j) Tissue level view of liposome distribution in kdrl:GFP transgenic embryos, 1 h after injection with DOPG and DSPC liposomes at 102 hpf. Liposome accumulation is observed in the entire caudal vein (CV), but only on the dorsal side of the PCV (dPCV, arrows).