
|
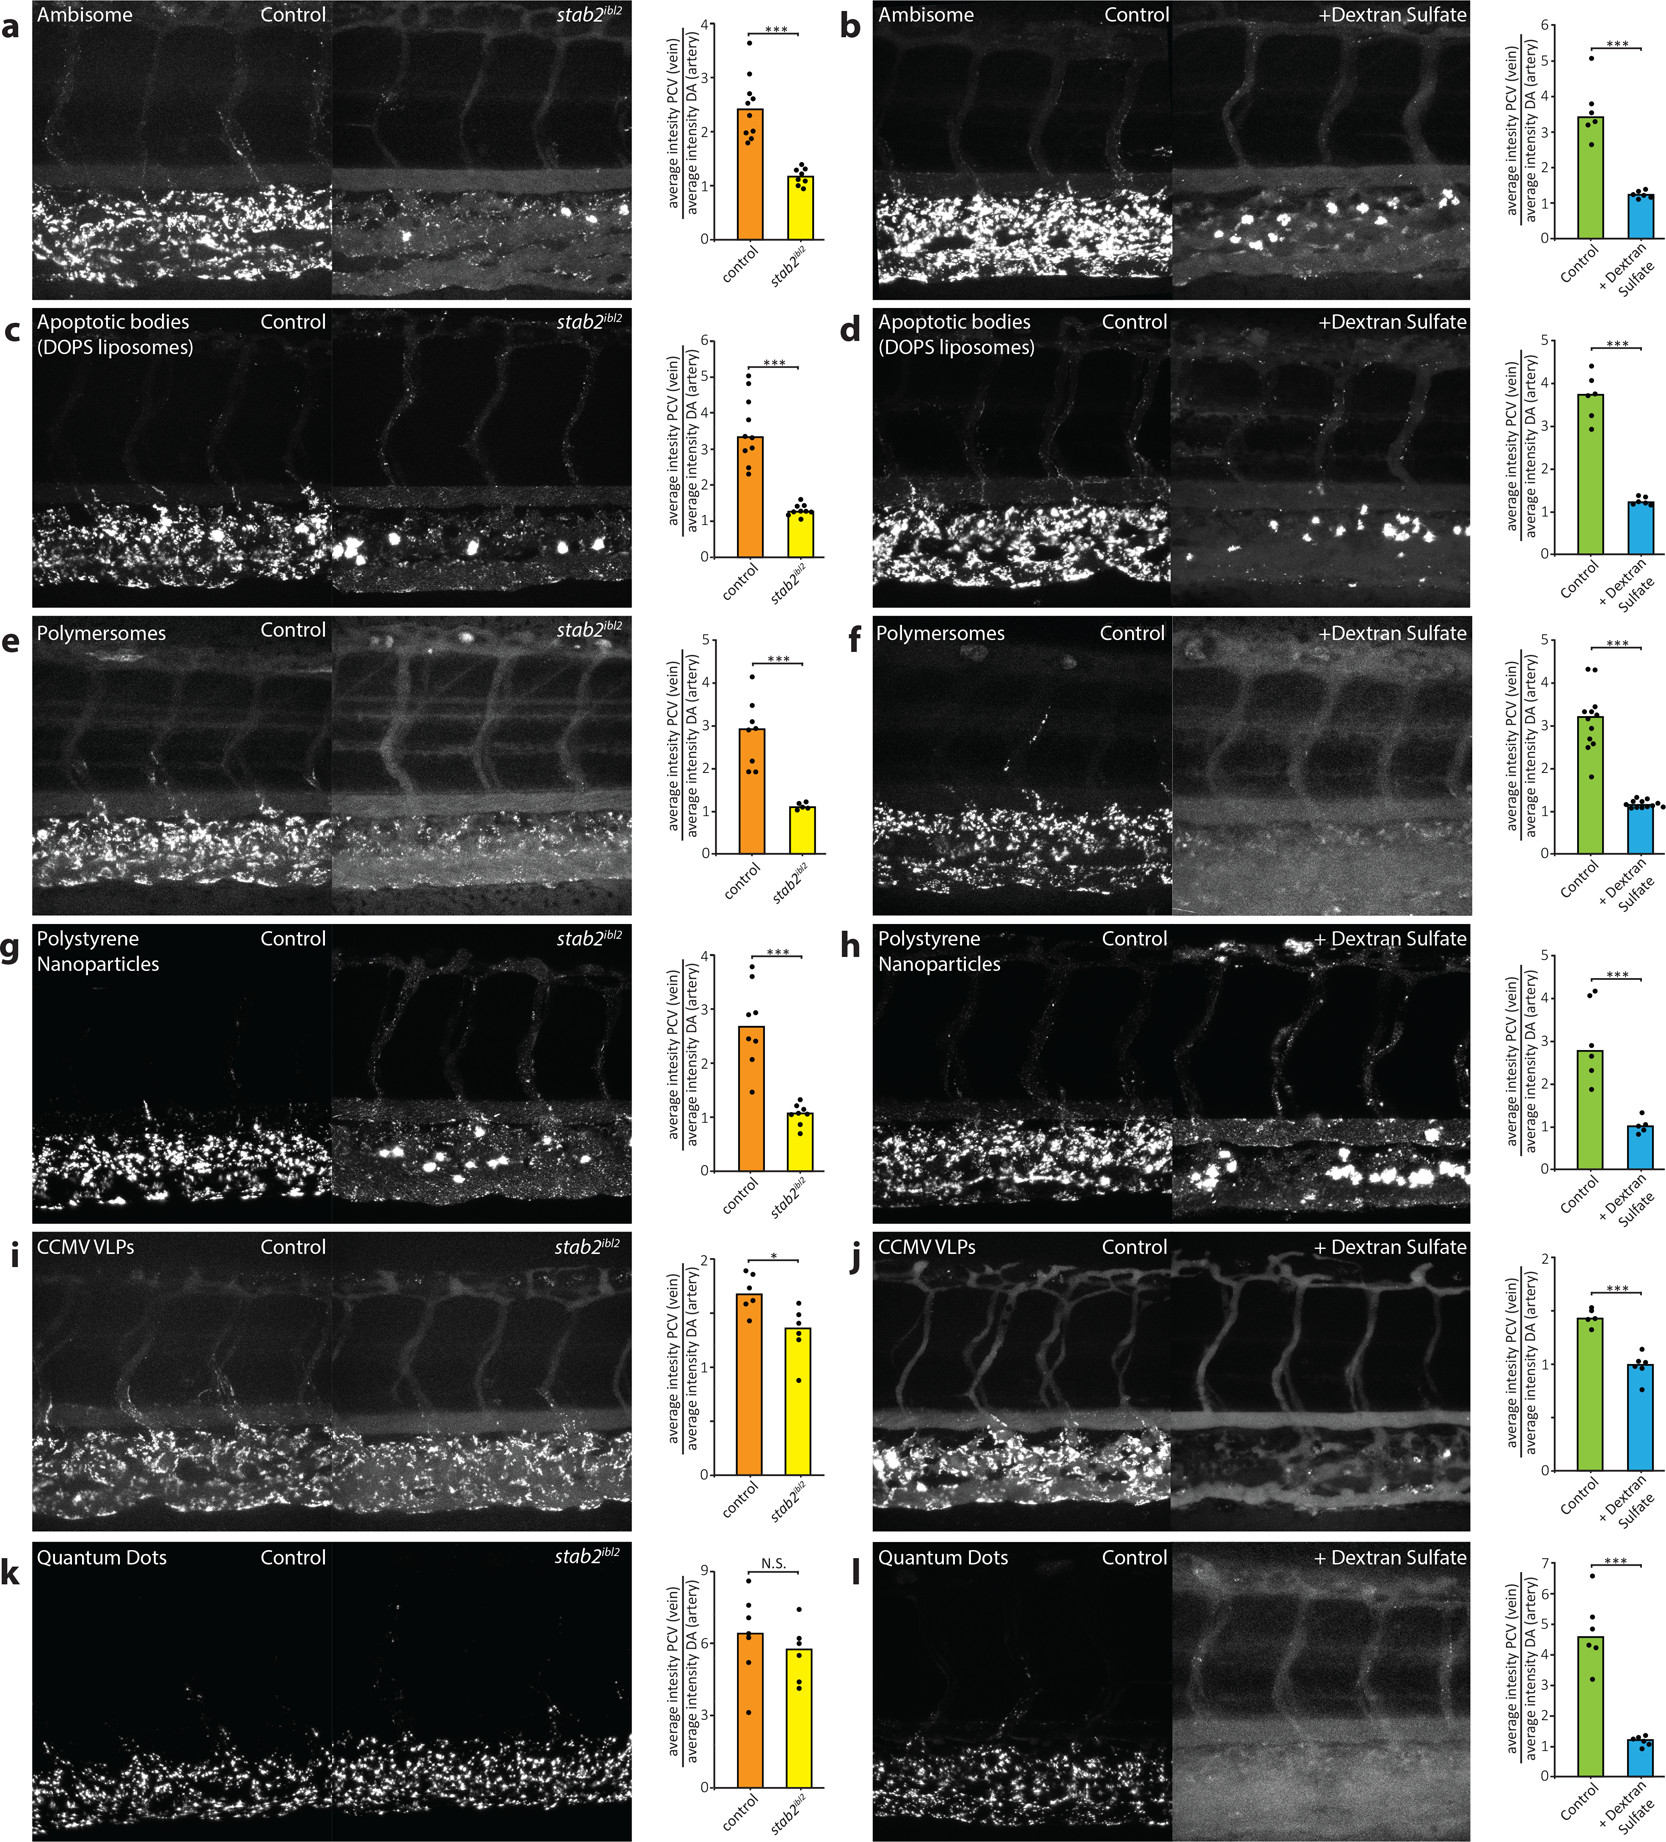
Fig. 4
stab2-mediated scavenging of anionic nanoparticles in vivo. (a–i) Tissue level view of DOPS liposome (a, b), PIB-PEG polymersome (c, d), carboxylated polystyrene nanoparticle (e, f), CCMV virus-like particle (g, h), and carboxylated quantum dot (i, j) distribution at 1 hpi in stab2ibl2 and sibling control embryos (a, c, e, g, i) or control and dextran sulfate injected embryos (b, d, f, h, j). Quantification of nanoparticle levels associated with venous vs arterial endothelial cells based on rhodamine fluorescence intensity associated with caudal vein vs DA. (a–j) Bar height represents median values, dots represent individual data points, and brackets indicate significantly different values (*: p < 0.05, **: p < 0.01, ***: p < 0.001, N.S.: not significant) based on Mann–Whitney test. n = 5–12 per group (in two experiments).