
- Title
-
Extrinsic mechanical forces mediate retrograde axon extension in a developing neuronal circuit
- Authors
- Breau, M.A., Bonnet, I., Stoufflet, J., Xie, J., De Castro, S., Schneider-Maunoury, S.
- Source
- Full text @ Nat. Commun.

Quantitative live imaging analysis of cell movements during OP morphogenesis. Live imaging of OP morphogenesis was performed between the 12 somites (12?s) and 24?s stages. a, b Schematic views of the head regions of 12?s a and 24?s b embryos. For each stage, the right panel shows a lateral view (orientation of the microscope objective indicated with a grey arrow). The left panel represents the optical section indicated by double arrows in lateral views. b brain, is isthmus, mb midbrain, oc optic cup, op olfactory placode, t telencephalon. c Live imaging on a ngn1:gfp embryo between 12 and 24?s, showing the progressive coalescence of the two elongated GFP+?OP domains into compact and spherical clusters on each side of the brain (XY dorsal view of the head, maximum projection of a 92?�m Z-stack). Asterisks indicate GFP expression in the brain. d YZ sections corresponding to the images shown in c, with H2B-RFP-labelled nuclei (magenta), showing the shape of the brain and placode tissues along the DV axis. Scale bars: 50?�m. e Tracks of anterior, central and posterior placodal cells (as defined in Supplementary Fig. 4b), merged at their origin, and associated directions of movement (as defined in Supplementary Fig. 4c). All cells were tracked throughout the morphogenesis process, during a 500?min period of time. f Representative tracks of placodal cells from three different AP positions (magenta), overlying skin cells (green) and adjacent brain cells (blue). Skin cells are located above the brain and the placode. Dots represent initial positions. The dotted grey line indicates the brain surface at 12?s. Cells from placode extremities move parallel to the brain surface to converge towards the centre of the placode (convergence movements along the AP axis, full arrows), then move laterally, away from the brain (lateral movements along the ML axis, dotted arrows). Central cells undergo lateral movements only. g MSD plot and its log equivalent for placode, skin and brain cell trajectories. ? is the slope of the log plot and is used an indicator of directional (>1) vs. diffusive (=1) movement |
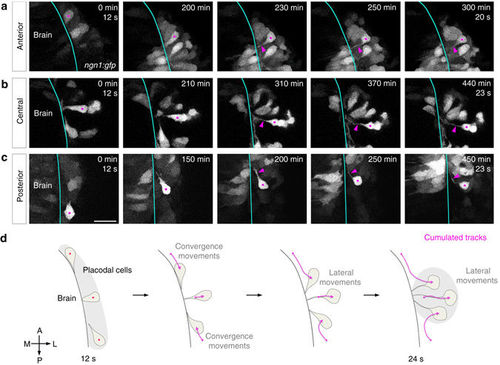
Analysis of cell morphologies during OP morphogenesis. Images extracted from movies on stable a, c or transient b ngn1:gfp transgenic embryos, showing the movement and morphologies of anterior a, central b and posterior c OP cells. Magenta dots label cell bodies of neurons of interest (strongly GFP+) and magenta arrowheads point to their protrusions contacting the brain. Scale bar: 25?�m. d Schematic representation of the cell morphologies observed during OP morphogenesis for cells from different AP positions, and the associated cumulated tracks (magenta arrows). Grey regions represent the initial and final shapes of the OP. All images represent dorsal views |
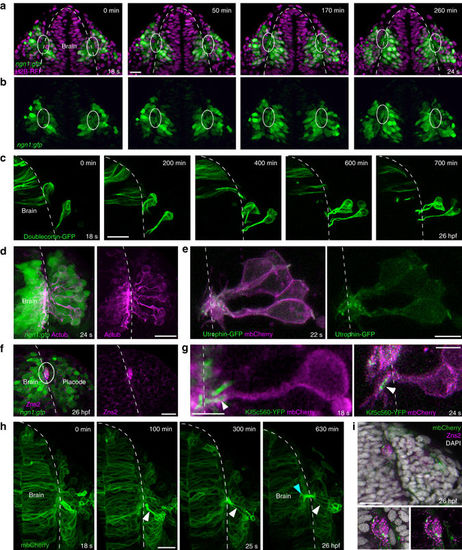
Axonal identity of the cytoplasmic protrusions. All images represent dorsal views; dotted white lines indicate the brain surface. a, b XY sections extracted from a movie performed on a ngn1:gfp embryo injected with H2B-RFP mRNA. From 18?s onwards, the cytoplasmic processes connecting cell bodies to the brain form a bundle of GFP+?protrusions juxtaposed to the brain surface, in the ventromedial region of the placode (framed with white lines). c Live imaging on a wild-type embryo transplantated with Doublecortin?GFP-expressing cells, showing microtubules in the shaft of the protrusions and around cell bodies during cell movements. d Acetylated tubulin immunostaining (magenta) performed on a ngn1:gfp embryo, indicating the presence of stable microtubules in GFP+?protrusions and cell bodies at 24?s. e Mosaic labelling of actin and membranes, obtained with a transplantation of Utrophin-GFP (green) and mbCherry (magenta) expressing cells in a wild-type embryo. f Immunostaining for the OP pioneer axon marker Zns2 (magenta) on a ngn1:gfp embryo, labelling the bundle of GFP+?protrusions at 26?hpf (white lines). g High magnification of OP cells expressing mbCherry and the axonal specification marker Kif5c560-YFP, showing the accumulation of Kif5c560-YFP at the tip of the protrusions (arrowhead) during lateral movements. On the left, the embryo was co-injected with Kif5c560-YFP mRNA and pCS2-mbCherry DNA, explaining why some of the Kif5c560-YFP?+?accumulations are not associated with magenta cells. On the right, a wild-type embryo was transplanted with cells co-expressing Kif5c560-YFP and mbCherry mRNAs. h Long-term live imaging of an embryo injected with mbCherry (green) mRNA, from 18?s to 26?hpf stages. A few OP cells express higher levels of mbCherry, which allows to visualise the elongation of their protrusions during lateral movements (white arrowheads), and their entry into the brain territory (green arrowhead). i Zns2 immunostaining (magenta) performed on the embryo imaged in h, showing the mbCherry+?protrusions within the Zns2+?bundle at 26?hpf. Scale bars: 25?�m in a, c, d, f, h, i, and 10?�m in e, g |

Effects of Colcemid, Blebbistatin and Rockout treatments on OP morphogenesis. a Colcemid-treated ngn1:gfp embryos do not show any defects in OP morphogenesis at 24?s, as compared with DMSO controls. b Quantification of OP length and width at 24?s, in colcemid-treated embryos and DMSO controls. c Blebbistatin-treated ngn1:gfp embryos exhibit longer and thinner OPs at 24?s as compared with DMSO controls. d Quantification of OP length and width at 24?s in blebbistatin-treated embryos and DMSO controls. e ngn1:gfp embryos treated with Rockout show morphogenesis defects that are similar to those of blebbistatin-treated embryos. f Quantification of OP length and width at 24?s in embryos incubated with Rockout or DMSO. n indicates the number of analysed placodes (one placode per embryo) in each condition. p values: unpaired two-tailed t-tests. Scale bar: 50?�m |

Mosaic perturbation of RhoA and Rac function. a Transplantation experiment set-up: cells from ngn1:gfp donor embryos co-expressing mbCherry and a dominant-negative form of RhoA (DN-RhoA) or of Rac (DN-Rac), or mbCherry alone (controls) were transplanted into ngn1:gfp host embryos, in order to achieve a mosaic perturbation of RhoA or Rac function. b Examples of embryos showing transplanted cells spanning the whole OP in controls, and instances of ectopic posterior and anterior transplanted cells expressing DN-RhoA. The right panel shows a DN-RhoA+?cell occupying a lateral position in the host placode. Insets show individual cells or cell groups expressing DN-RhoA, co-stained with DAPI to show that these cells are alive. Scale bar: 50?�m. c Spatial distribution of transplanted cells at 24?s, in control (dark grey) and DN-RhoA (orange) conditions, and projections of the spatial distribution along the AP and ML axis. The reference point is defined as the position of the axon bundle on the brain surface. ? 2-tests are used to identify statistically different distributions (***p?<?0.001). DN-RhoA+?cell distribution is more spread than that of control cells along the AP axis, but not along the ML axis, showing that DN-RhoA cell autonomously affects AP distribution of cells, but not their lateral dispersion. d Same analysis as in (c) with DN-Rac conditions in orange. Distributions are statistically different both along the AP axis and along the ML axis. As for DN-RhoA, DN-Rac+?cell distribution is more spread along the AP axis than in controls. Along the ML axis, DN-Rac+?cells distribute further laterally as compared to control cells, suggesting more efficient lateral movement |

Actomyosin dynamics and protrusive activity during convergence and lateral cell movements. a Schematic view of cells imaged in b, c. Wild-type embryos were transplanted with cells from a �actin:myosinII-GFP transgenic donor injected with mbCherry mRNA. b Anterior OP cells undergoing convergence movements towards the placode centre. Dynamic accumulations of myosin II can be observed in the cell bodies, in the front or back of moving cells (white arrows). The yellow arrow indicates myosin II accumulation during ring contraction after a cell division. c Central OP cells undergoing lateral movements. No myosin II can be detected in the cell bodies. Myosin II rather accumulates at the tip of the axonal protrusions (arrows). Coloured dots indicate the cell bodies of cells of interest. d Schematic view of cells imaged in e, f. Wild-type embryos were transplanted with cells from a donor embryo expressing Utrophin-GFP (actin probe) and mbCherry. e Anterior OP cells converging along the brain surface exhibit canonical morphologies of actively migrating cells, with dynamic filopodia (white arrowheads) and actin accumulation at their leading edge. Green arrows indicate protrusions that do not belong to the two cells of interest, but to a more anterior cell following them. f In cells moving laterally, filopodia and actin are observed at the tip of axons, but not at the level of the cell bodies. Scale bars: 10?�m |

Analysis of the role of axons in lateral cell movement. a Images extracted from a movie performed on an embryo expressing mosaic ngn1:gfp after laser ablation of an axon. Cell tracks are represented in magenta for the cell with the ablated axon and in white for three neighbouring cells. Magenta arrowheads point to the tip of the ablated axon during its regrowth towards the brain surface. b, c Direction of movements and MSD analysis for the cells with ablated axons as compared with neighbouring cells, during the period of time that preceeds the formation of the new axon/brain contact. d Images extracted from a movie performed on an embryo expressing mosaic ngn1:gfp and treated with colcemid from 12?s onwards. Yellow tracks show the convergence of two anterior cells, and magenta tracks show the lateral movements of round, axonless cells. e, f Direction of movements and MSD analysis for lateral movements of the round axonless central cells, as compared with wild-type untreated central cells. Scale bars: 20?�m |
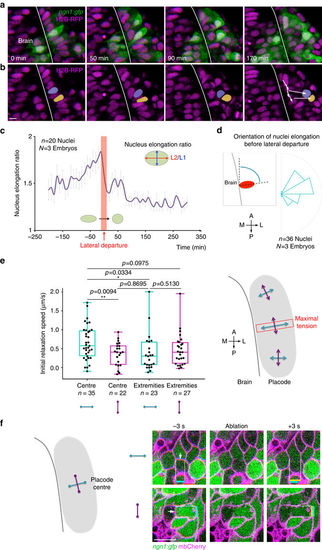
Nuclei deformation patterns and mapping of mechanical tension with laser ablation of cell/cell contacts. a, b Images extracted from a movie performed on a ngn1:gfp embryo injected with H2B-RFP mRNA. In the centre of the placode, the nuclei of cells are initially highly deformed and elongated along the ML axis. In b, the nuclei of two cells undergoing lateral movements, drawn in yellow and purple, retrieve a round morphology right after their lateral departure. c Quantification of changes in nuclei elongation ratio before, during and after the lateral departure of OP cells, showing that lateral departure coincides with a decrease in the elongation ratio (averaged on n?=?20 nuclei from N?=?3 embryos). d Rose plot showing the angle of nuclei elongation right before their lateral departure (n?=?36 nuclei from N?=?3 embryos). e Laser ablation of cell/cell contacts was performed around 16?s, in OP extremities and in the placode centre, on interfaces oriented parallel (purple) or perpendicular (blue) to the brain surface. Graphs show the initial relaxation speed, used as a proxy for the interface tension, in different locations and orientations. The highest tension was measured in the OP centre, along intercellular contacts that are perpendicular to the brain. n indicates the number of ablated cell/cell interfaces in each condition (data pooled from seven experiments). The schematic view on the right summarises the results. p values: two-tailed unpaired t-test. f Representative examples of ablation of cell/cell contacts in the OP centre, oriented perpendicular and parallel to the brain surface. The white arrows indicate the ablated cell/cell contacts. Coloured bars show the vertex?vertex distance before (blue) and right after (yellow) ablation. Scale bars: 10?�m |
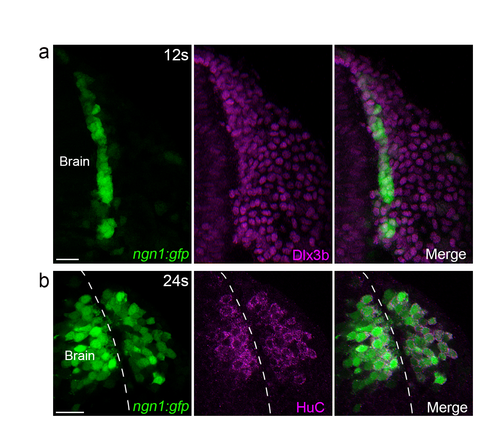
Characterisation of the ngn1:gfp transgenic line in the head during OP coalescence. (a) Dlx3b immunostaining performed on a ngn1 :gfp embryo at 11-12s. GFP (green) is expressed in a narrow cell domain flanking the anterior brain and expressing Dlx3b (magenta), a marker for OP cells. (b) Hue immunostaining (magenta) performed on a ngn1 :gfp embryo at 24s, showing co-localisation between GFP and Hue. Scale bars: 25 �m. |

Apoptosis is not involved in OP morphogenesis. (a) ngn1:gfp embryos incubated with a pan-caspase inhibitor (right) or DMSO (left) from 12s to 24s, stained with an anti-activated Caspase3 antibody (magenta). Dotted lines surround the two paired OPs. No morphogenesis phenotype can be detected upon apoptosis inhibitor treatment. (b) Quantification of OP length and width at 24s in embryos treated with the caspase inhibitor or DMSO controls. n indicates the number of analysed placodes (1 placode per embryo) in each condition. p values: unpaired two-tailed t-tests. Scale bar: 25 �m. |

Proliferation and associated cell size changes are not involved in OP morphogenesis. (a) Spatial distribution of PH3+ dividing cells in ngn1:gfp placodes at 16s and 24s. Comparison with a uniform distribution using a Chi2 test gave a p value>0.05, showing the uniform distribution of dividing cells. (b) Graphs showing the decrease in PH3+ cells at 16s, and the decrease in GFP+ cell numbers in OPs at 24s observed in embryos treated with the anti-proliferation drugs hydroxyurea and aphidi�colin (HUA), or DMSO. (c) ngn1 :gfp embryos incubated with HUA or DMSO from 12s to 24s, showing no overt OP morphogenesis defects upon HUA treatment. Dotted lines surround the two paired OPs. (d) Quantification of OP length and width at 24s in embryos treated with HUA or DMSO controls. In (b) and (c) n indicates the number of analysed placodes in each condition. p values: unpaired two-tailed t-tests. (e,f) ngn1:gfp embryos injected with mbCherry mRNA were fixed and stained with DAPI at 12s and 24s. Individual cell bodies were reconstructed in 3D using the mbCherry staining. Right panels show examples of reconstructed cells, corresponding to the cells highlighted in magenta in the left panels. (g) The 3D cell reconstruction allowed to quantify cell volume, cell height (along the DV axis) and cell area (maximum XY area) at 12s (n= 15 cells from N=6 placodes) and 24s (n= 15 from N=4 placodes). p values: unpaired two-tailed t-tests. Cell volume is smaller at 24s than at 12s, which is mostly due to a smaller cell size in the XY plan, rather than a reduc�tion of cell height in the DV (Z) axis. (h) Nucleus area correlates with cell area, and can thus be used as a readout for cell size. (i) Instance of a placodal cell undergoing division, showing the decreased area in the two daughter cells, compared with the mother cell. U) Dynamic measurement of areas of placode cell nuclei in live imaging experiments, showing that cell division coincides with a reduction in the area of nuclei (averaged on n=13 cells). (k) DAPI staining on 24s ngn1:gfp embryos incubated with HUA (rigth) or DMSO (left), showing plac�odes with similar size but bigger cells in HUA-treated embryos. (I) Quantification of OP volume and average cell volumes in embryos treated with HUA or DMSO. n indicates the number of analysed placodes in each condition p values: unpaired two-tailed t-tests. Scale bars: 25 �m except in I: 5 �m. |

Analysis of neighbour exchange during OP morphogenesis. (a) To assess whether cells exchange neighbours during OP morphogenesis, we analysed the tracks of cell neighbours, and measured the initial distance (id, at 12s) and the final distance (fd, at 24s) separating the two cell centres. (b) Examples of 3D tra�jectories for anterior, central and posterior pairs of cells, showing an overall coordination of their movements, with a small in�crease in the distance separating their centres. (c) Quantification of initial and final distances between cell pairs (n= 13 cell pairs) shows that the distance is doubled during morphogenesis, suggesting short-range cell intermixing. p value: two-tailed paired t-test. (d) Photoactivation of Kaede in small groups of placodal cells at 12s results in a local intermingling of green (not photoacti�vated) and magenta (photoactivated) cells at 24s. Scale bar: 25 �m. |
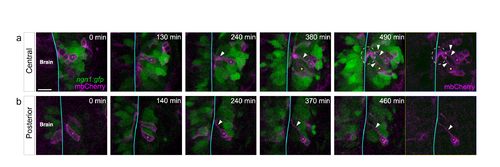
Morphologies of placodal cells expressing low levels of GFP. (a,b) Two time lapse sequences showing instances of central (a) and posterior (b) low ngn1:gfp+ cells undergoing lateral move�ments. Cells of interest are indicated with pink and yellow dots. The brain surface is indicated by a blue line. While moving lateral�ly, the cells (labelled with mosaic mbCherry) extend a long cytoplasmic process contacting the brain surface (white arrowheads), as shown for high GFP-expressing cells in Figure 2. On the up right panel, note that all the protrusions of mbCherry-labelled plac�ode cells meet to form a bundle on the brain surface {white dotted line). Scale bar: 25 �m . |
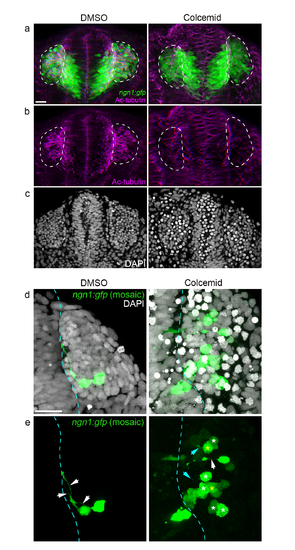
Additional results for colcemid treatment experiments. (a,b) ngn1:gfp embryos treated with colcemid or DMSO, and stained for acetylated tubulin at 24s. (a) shows the merge picture, and (b) the acetylated tubulin staining only. The acetylated tubulin appears affected and disorganised in the head of colcemid-treated embryos, and is strongly reduced in OPs (surrounded by white dotted lines). (c) XY sections of DAPI staining of the embryos shown in (a) and (b). Note the numerous nuclei blocked in mitosis in colcemid-treated embryos. These results confirm that colcemid treatment affects microtubule dynamics and metabolism. (d,e) Wild type embryos were injected with ngn1:gfp DNA to obtain a mosaic labelling of OP neurons, treated with colcemid or DMSO and stained for DAPI at 24s. In DMSO controls, mosaic labelling allows to visualise axonal protrusions connecting cell bodies to the brain surface (white arrows). In colcemid-treated embryos, some GFP+ cells possess a normal axonal protrusion (white arrow), but a significant proportion of GFP+ cells show shorter axons that do not contact the brain (yel�low asterisks indicate the cell bodies of such cells, and blue arrows their short protrusions) or no axonal protrusion at all (white asterisks indicate their somata). Scale bars: 25 �m. |

Pacodal cells exhibit filopodia and lamellipodia-like protrusions during convergence. Live imaging on a wild type embryo transplanted with mbCherry and H2B-RFP co-expressing cells, from 12s onwards. Note the filopodia in the front of posterior placodal cells converging towards the center (white arrows), but also the presence of large lamellipodia-like protrusions (green arrows). The white line indicates the brain surface. XY dorsal view, anterior to the top, scale bar: 5 �m. |
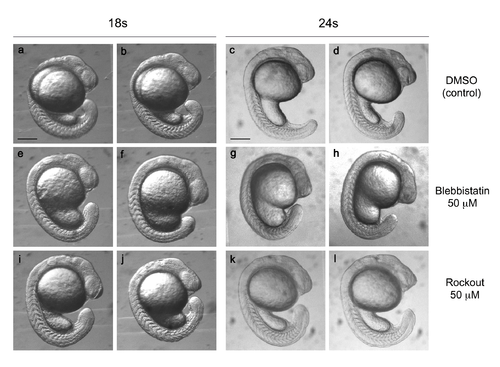
Blebbistatin and Rockout-treated embryos are alive and develop at normal speed. Zebrafish embryos incubated from the 12s stage with 50 �M blebbistatin (a-d), 50 �M Rockout (e-h), or DMSO (i-I) and let to develop until the 18s or the 24s stage. Both treatments led to a thickening of the yolk sac extension at 18s (arrowheads). This thickening persisted at 24s only in Blebbistatin-treated embryos. Overall embryo development was similar in all three conditions. Scale bars: 200 �m. |