
|
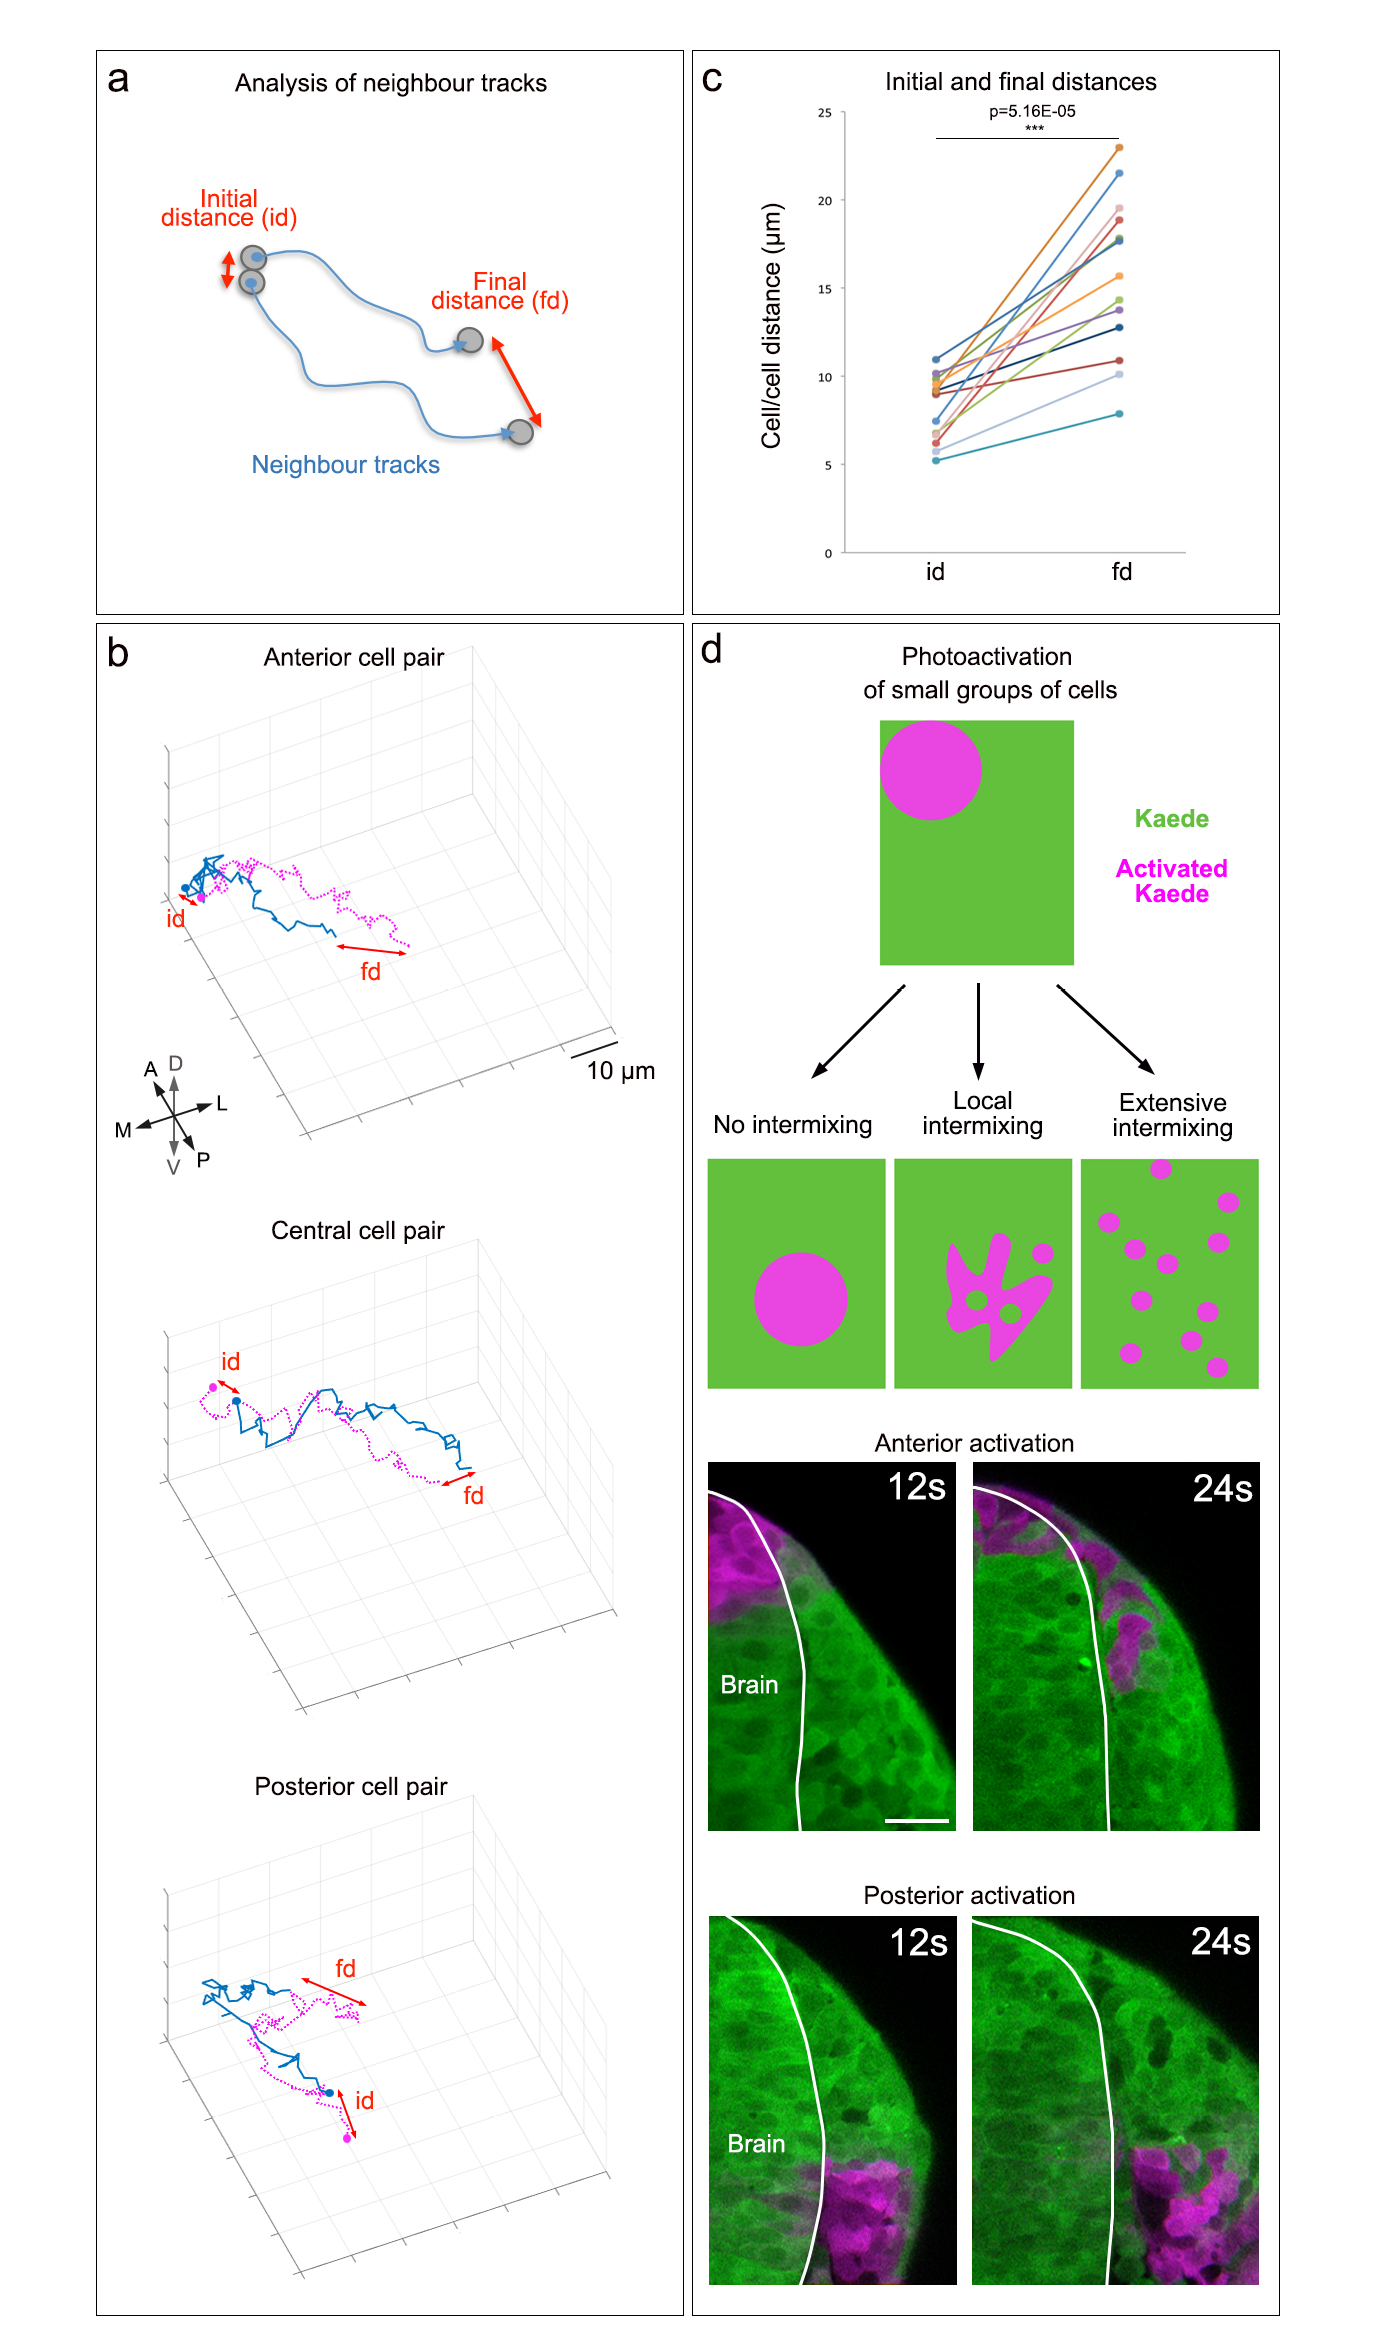
Fig. S5
Analysis of neighbour exchange during OP morphogenesis. (a) To assess whether cells exchange neighbours during OP morphogenesis, we analysed the tracks of cell neighbours, and measured the initial distance (id, at 12s) and the final distance (fd, at 24s) separating the two cell centres. (b) Examples of 3D trajectories for anterior, central and posterior pairs of cells, showing an overall coordination of their movements, with a small increase in the distance separating their centres. (c) Quantification of initial and final distances between cell pairs (n= 13 cell pairs) shows that the distance is doubled during morphogenesis, suggesting short-range cell intermixing. p value: two-tailed paired t-test. (d) Photoactivation of Kaede in small groups of placodal cells at 12s results in a local intermingling of green (not photoactivated) and magenta (photoactivated) cells at 24s. Scale bar: 25 µm.