
- Title
-
In Vivo Characterization of an AHR-Dependent Long Noncoding RNA Required for Proper Sox9b Expression.
- Authors
- Garcia, G.R., Goodale, B.C., Wiley, M.W., La Du, J.K., Hendrix, D.A., Tanguay, R.L.
- Source
- Full text @ Mol. Pharmacol.
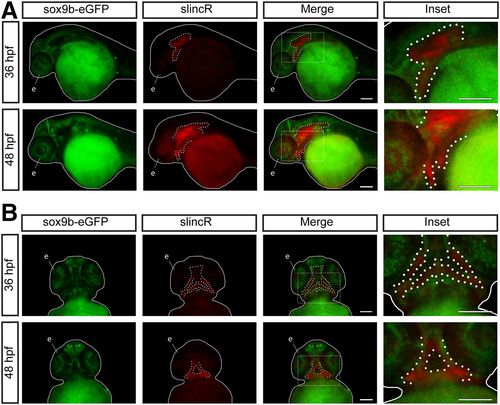
SlincR and sox9b-eGFP are expressed in adjacent and overlapping tissues through multiple stages of development. Lateral (A) and ventral (B) views of dual immunohistochemistry and in situ hybridization samples targeting sox9b-eGFP (green) and slincR (red) in sox9b-eGFP reporter fish at 36 and 48 hpf (n = 6–10 embryos). The fish are outlined with a white line, slincR expression is outlined with a dotted white line, and the eye is labeled the letter e. The white rectangle represents the magnified area depicted in the inset. Both scale bars represent 100 µm. All experiments were independently repeated a minimum of two times. |
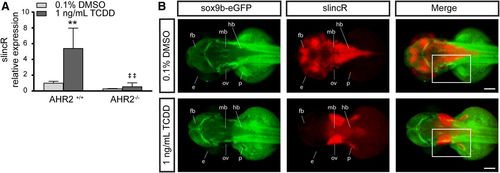
Comparative analysis of AHR2 functional status and slincR expression levels and spatial pattern relative to sox9b. (A) SlincR expression in 48 hpf wild-type 5D (AHR2+/+) and AHR2-null (AHR2−/−) whole embryos developmentally exposed to 0.1% DMSO (vehicle control) or 1 ng/ml TCDD (n = 3 biologic replications). Results were statistically analyzed using the GraphPad Prism 7.02 software. The data were tested for normality using the Shapiro-Wilk normality test, analyzed with two-way analysis of variance, and correction for multiple comparisons was performed using the Dunnett’s test (95% confidence intervals). Error bars indicate S.D. of the mean. **P < 0.01 compared with DMSO control. ##P < 0.01 compared with TCDD control. (B) Dorsal view of dual immunohistochemistry and in situ hybridization samples targeting sox9b-eGFP (green) and slincR (red) in 48 hpf embryos (n = 6–10 embryos). The Tg(−2421/+29sox9b:EGFPuw2) sox9b reporter line embryos were developmentally exposed to 0.1% DMSO or 1 ng/ml TCDD. In the TCDD-exposed samples, the regions with increased slincR expression had a corresponding decrease in sox9b-eGFP expression (white rectangle); e = eye, ov = otic vesicle, p = pectoral fin, fb = forebrain, mb = midbrain, and hb = hindbrain; 100 µm scale bar. All experiments were independently repeated a minimum of two times. |
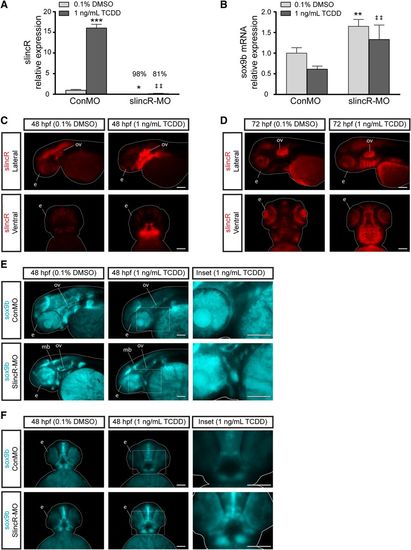
Comparative analysis of the relative expression of slincR and sox9 in TCDD-exposed samples. SlincR (A) and sox9b mRNA (B) quantitative expression in 48 hpf whole embryo slincR (slincR-MO) and control (ConMO) morphants developmentally exposed to 0.1% DMSO (vehicle control) or 1 ng/ml TCDD. For all quantitative PCR data, expression values were analyzed using the 2−ΔΔCT method. Expression values were normalized to β-actin and the control morphants served as the calibrator. Samples represent a minimum of three biologic replicates. Results were statistically analyzed using the GraphPad Prism 7.02 software. The data were tested for normality using the Shapiro-Wilk normality test and analyzed with two-way analysis of variance and correction for multiple comparisons was performed using the Dunnett’s test (95% confidence intervals). Error bars indicate S.D. of the mean; *P < 0.05, **P < 0.01, ***P < 0.001 compared with controls; ##P < 0.01 compared with TCDD control. (C–F) dorsal and lateral views of in situ hybridization samples targeting slincR (red) and sox9b (blue) in 48 hpf (C, E, and F) and 72 hpf (D) embryos (n = 6–10 embryos). (C and D) Representative images from control morphants. In the TCDD-exposed samples, slincR morphants displayed increased sox9b expression patterns compared with controls (white rectangle, which represents the magnified image in the inset). The fish are outlined with a white line; e = eye, ov = otic vesicle, p = pectoral fin, and mb = midbrain; 100 µm scale bar. All experiments were independently repeated a minimum of two times. EXPRESSION / LABELING:
PHENOTYPE:
|
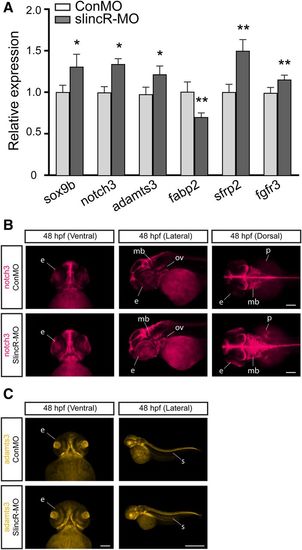
Comparative analysis of the relative expression of sox9b and downstream targets in slincR morphants. (A) Quantitative expression levels of sox9b and downstream targets in slincR and control morphants at 48 hpf. Five out of the nine downstream target genes were significantly different when compared with control morphants. Expression values were analyzed using the 2−ΔΔCT method, normalized to β-actin, and the control morphants served as the calibrator. Samples represent a minimum of three biologic replicates. Results were statistically analyzed using the GraphPad Prism 7.02 software. The data were tested for normality using the Shapiro-Wilk normality test, analyzed using a paired t test, and corrected for multiple comparisons using the Holm-Sidak method, with α = 0.05. Error bars indicate S.D. of the mean; *P < 0.05, **P < 0.01 compared with controls. Dorsal, ventral, and lateral views of in situ hybridization samples targeting notch3 (B) and adamts3 (C) in 48 hpf slincR and control morphants (n = 6–10 embryos); e = eye, ov = otic vesicle, p = pectoral fin, s = somite, and mb = midbrain; 100 µm scale bar. |

Phenotypic analysis of reduction in slincR expression during early development. (A) An 18-endpoint morphologic screen in slincR and control morphants at 120 hpf (n = 24). No significant malformations were observed in the slincR morphants. Control and slincR morphant evaluations were completed in a binary notation (present/absent) and statistically compared using Fisher’s exact test at P < 0.05 for each endpoint. (B) Larval photomotor response (LPR) in control and slincR morphants at 120 hpf (n = 23) using the Viewpoint Zebrabox systems. SlincR morphants displayed a hypoactive response (P < 0.01), with −14.04% difference of the mean area under the curve when compared with controls. The LPR assay consisted of 3 minutes of light and dark alternating periods, for a total of four light-dark transitions, with the first transition representing an acclimation period. The black and white bar along the y-axis indicates the 3 minutes of light (white) and dark (black) alternating periods. Larval zebrafish at this developmental stage display increased locomotion during periods of darkness. The overall area under the curve was analyzed for the last three light-dark cycles compared with control morphants using a Kolmogorov-Smirnov test (P < 0.01). All experiments were independently repeated a minimum of two times. PHENOTYPE:
|
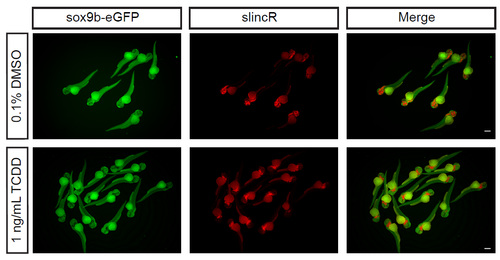
Group images of dual immunohistochemistry and in situ hybridization samples targeting sox9beGFP (green) and slincR (red) in sox9b-eGFP reporter fish at 48 hpf developmentally exposed to 0.1% DMSO (vehicle control) or 1 ng/mL TCDD. Scale bars represent 300 μm. |

Group images of in situ hybridization samples targeting slincR (red) in slincR and control morphants at 48 hpf developmentally exposed to 0.1% DMSO (vehicle control) or 1 ng/mL TCDD. Scale bars represent 300 μm. |