
- Title
-
Eph-ephrin signaling maintains the boundary of dorsal forerunner cell cluster during morphogenesis of the zebrafish embryonic left-right organizer
- Authors
- Zhang, J.F., Jiang, Z., Liu, X., Meng, A.
- Source
- Full text @ Development

Blockage of Eph signaling disrupts laterality development in zebrafish embryos. Wild-type embryos treated with LCA or injected with s-efnb2a mRNA were analyzed. (A,A′) Defects in heart looping as visualized by cmlc2 expression at 48hpf. Different types of looping are shown in ventral view (A) and the proportions of embryos exhibiting each type are shown in the graph (A′). (B,B′) Defects in laterality of liver (l) and pancreas (p) as visualized by foxa3 expression at 48hpf, shown in dorsal view (B) with quantitative data shown in the graph (B′). (C,C′) Defects in KV at 10 SS. The tail region was viewed dorsally (C) with visible KV indicated by arrowheads. The proportions of embryos exhibiting each phenotype are shown in the graph (C′). (D,D′) Defects in DFCs aggregation as visualized by sox17 expression at 75% ES. The representative types of embryos are shown in D with the proportions of embryos exhibiting each type shown in D′. a, atrium; g, gut/intestine; v, ventricle; n, number of embryos observed. EXPRESSION / LABELING:
PHENOTYPE:
|
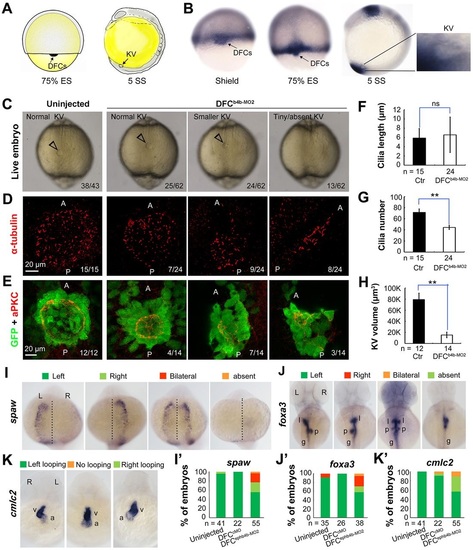
ephb4b is required for KV formation and LR asymmetrical development. (A) Illustration of DFCs at 75% ES (dorsal view) and KV at 5 SS (lateral view). (B) ephb4b expression pattern at the indicated stages. (C-H) Effects of DFC-specific ephb4b knockdown on KV size (C), cilia (D,F,G) and KV lumen (E,H) as analyzed at 10 SS. KV in live embryos (C) is indicated by open arrowheads and embryo ratios with different KV sizes are indicated. Cilia were visualized by acetylated tubulin immunofluorescence (D), and cilia number (F) and length (G) were analyzed. The apical surface of KV cells in Tg(sox17:GFP) embryos was labeled by co-immunostaining with anti-aPKC (red) and anti-GFP antibodies (green) (E), and the KV lumen size was measured on confocal images (H). A and P indicate the anterior and posterior sites of KV, respectively. In D and E, embryo ratios with the representative pattern are indicated. Error bars indicate s.e.m.; n, embryo number; ns, not statistically significant; **P<0.01. (I-K′) Effect of DFC-specific knockdown on spaw expression at 21 SS (I; dorsal views), foxa3 expression in liver (l), pancreas (p) and intestine (g) at 48hpf (J; dorsal views), and cmlc2 expression in the ventricle (v) and the atrium (a) of the heart at 48hpf (K; ventral views). The left and right sides are indicated by L and R, respectively. The proportions of embryos exhibiting each phenotype are shown in I′-K′. EXPRESSION / LABELING:
PHENOTYPE:
|
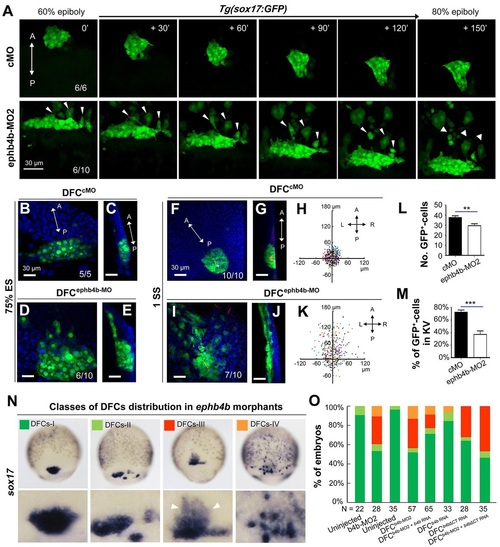
DFC-specific ephb4b is required for DFC clustering. (A) Time-lapse confocal images showing DFC migration in Tg(sox17:GFP) living embryos injected with MO at the 512-cell stage. The ratio of embryos with the representative pattern is indicated. Arrowheads indicate DFCs moving away from the cluster. See also Movies 1 and 2. (B-E) Aggregation of DFCs. Tg(sox17:GFP) embryos injected at the 512-cell stage were immunostained at 75% ES for GFP (green) and nuclei (DAPI; blue). B and D, dorsal views; C and E, lateral views. Note that some GFP-positive DFC cells have involuted to form a string of hypoblast cells in the ephb4b morphant (E). (F-M) Aggregation of KV cells. Injected Tg(sox17:GFP) embryos were immunostained at 1 SS for GFP (green), aPKC (red) and nuclei (DAPI; blue). F and I, dorsal views; G and J, lateral views. Note the presence of DFC-derived GFP-positive cells outside KV in the ephb4b morphant (I,J). The distribution of individual GFP-positive cells from ten embryos is illustrated by projecting them on x- and y-axes with the aPKC-labeled KV lumen as the cross-point (H,K). The number of GFP-positive cells inside and close to KV (L) and the percentage of GFP-positive KV epithelia (labeled by aPKC) (M) in ten embryos were compared. **P<0.01; ***P<0.001. (N,O) Disruption of sox17-expresssing DFCs in ephb4b morphants. The representative DFC cluster patterns are shown in N and the proportion of embryos exhibiting each pattern category are presented in O. The AP axis is indicated in A-K. EXPRESSION / LABELING:
PHENOTYPE:
|
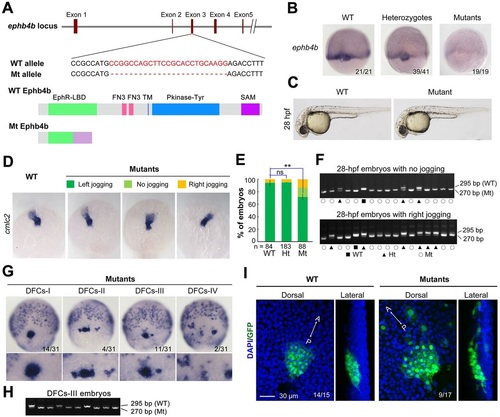
ephb4b genetic mutants exhibit defects in DFC aggregation and laterality. (A) Illustration of the ephb4b mutant allele (Mt) generated by the Cas9 knockout approach. (B) ephb4b expression pattern in different types of embryos at 75% ES. The siblings were genotyped after being photographed and the proportion of embryos exhibiting the representative pattern is indicated. (C) Morphology of live WT and mutant siblings at 28hpf. (D-F) Heart jogging was detected by probing cmlc2 expression at 28hpf (D) and quantified (E). ns, not significant; **P<0.01. After in situ hybridization, each embryo was genotyped by PCR as shown in F. (G) DFC aggregation was examined by probing sox17 expression at 75% ES. Shown are representative DFC patterns in mutants only. The DFC region is enlarged in the lower panels. (H) Representative genotyping results for DFCs-III embryos. (I) Embryos at the bud stage were immunostained for GFP expression and observed by confocal microscopy. The AP axis is specified. EXPRESSION / LABELING:
PHENOTYPE:
|
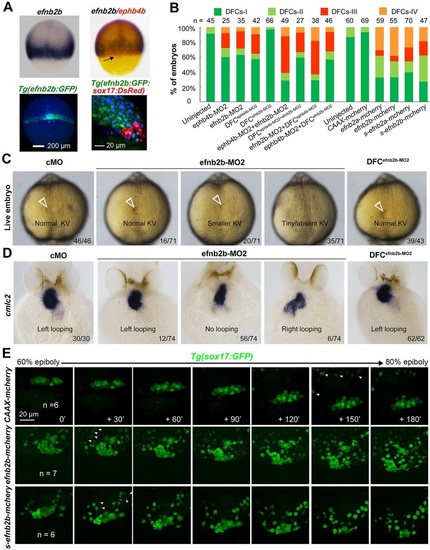
efnb2b expression outside DFCs is required for DFC aggregation, KV formation and laterality development. (A) efnb2b is not expressed in DFCs. Top panels: efnb2b (black)/ephb4b (red) in situ patterns with DFCs indicated (arrow) at 75% ES; bottom panels: Tg(efnb2b:GFP) embryo expressing GFP in the blastodermal margin at shield stage (left panel; dorsal view), and GFP+ mesoderm precursors located next to DsRed+ DFCs in Tg(efnb2b:GFP;sox17:DsRed) embryo at 75% ES (right panel: lateral view). (B) efnb2b knockdown in the whole embryo caused disaggregation of DFCs. Wild-type embryos were injected at the one-cell or 512-cell stage (DFCX) and probed at midgastrulation stages for sox17 expression by in situ hybridization. The distribution patterns of DFCs were categorized as shown in Fig. 3N. (C,D) Effect of efnb2b knockdown on KV at 10 SS (C) and on cmlc2-labeled heart looping at 48hpf (D). Arrowheads indicate the KV. Proportion of embryos exhibiting each phenotype is indicated. (E) Time-lapse observation of DFC migration during gastrulation in living embryos. Tg(sox17:GFP) embryos injected with the indicated mRNA at the one-cell stage were dynamically observed by confocal microscopy starting at 60% ES. Arrowheads indicate GFP-positive endoderm progenitors. The relative time points are indicated. Embryos were orientated with anterior to the top. n, number of observed embryos. See also Movies 5-7. EXPRESSION / LABELING:
PHENOTYPE:
|

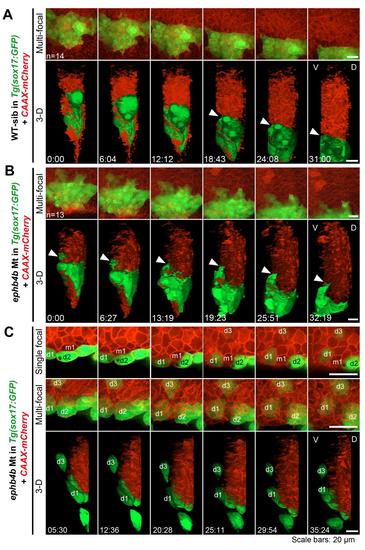
Contact duration between DFCs and non-DFC cells is increased by deficiency of Eph/ephrin signaling. The membrane of embryonic cells from crosses of ephb4b+/-;Tg(sox17:GFP) fish was labeled by expressing exogenous CAAX-mCherry (red) and embryos were observed during midgastrulation. (A-D) Multi-focal and 3D reconstituted time-lapse images of different types of protrusions of DFCs in ephb4b mutant (Mt) (B) and WT siblings (A,C,D). The full process of a single protrusion is shown with time points indicated. The arrowheads indicate protrusions at the middle phase. See also Movies 8 and 9. (E-G) Round-trip time of protrusions. The start and end time points of the process for each protrusion were judged from single-focal, multi-focal and 3D movies. Only well-recognized protrusions were included. Np, number of protrusions; Ne, number of embryos. |
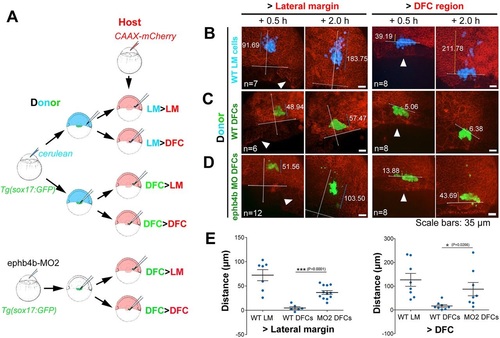
Migration behavior of transplanted DFCs and lateral mesodermal precursors. (A) Illustration of six types of transplantation. (B-D) Confocal images showing distribution of transplanted cells in host embryos at two time points post-transplantation. The horizontal line indicates the leading edge of the blastodermal margin; the long vertical line indicates the animal pole (top) to vegetal pole (AV) axis; the shorter line indicates the distribution distance (µm). Arrowheads indicate the presumed DFC cluster. See also Movie 10 for examples. (E) Distribution distance of transplanted cells 2h post-transplantation. For transplantation to lateral margin, the distance was the scattering distance of transplanted cells along the AV axis; for transplantation to the DFC region (vegetal to dorsal blastodermal margin), the distance was measured from the cell most close to the animal pole to the blastodermal margin. |

DFCs ectopically expressing efnb2b fail to aggregate with normal DFCs. CAAX-mCherry or efnb2b-mCherry mRNA was injected into the dorsal yolk of Tg(sox17:GFP) embryos at the 128- to 256-cell stages and embryos with uneven expression of the foreign gene in DFCs during early gastrulation were chosen for observation. (A) CAAX-mCherry-positive DFCs stayed together with other DFCS. (B) Efnb2b-mCherry-positive DFCs disaggregated with other DFCs. Shown are two representative embryos that expressed different levels of Efnb2b-mCherry. All embryos are dorsally viewed with arrows and arrowheads indicating boundaries (A) or protrusions (B). Time points are indicated. See also Movies 11 and 12. |

Ephb4b/Efnb2b signaling regulates DFC clustering through the RhoA pathway. (A) Ephb4b physically associated with Efnb2b. Myc-tagged zebrafish ephb4b and GST-tagged zebrafish efnb2b were transfected into HEK293T cells. (B) Ephb4b forward signaling activated RhoA signaling. Ephb4b-Flag and GST-rhotekin-RBD were transfected into HEK293T cells. The relative ratio of active RhoA is indicated. (C) Increase of p-MLC level by Ephb4b-Efnb2b interaction. Ephb4b-HA-expressing and Efnb2b-GST-expressing HEK293T cells were mixed and co-cultured, followed by immunoprecipitation and western blotting. The relative ratio of p-MLC is indicated. (D,E) Inhibition of the RhoA signaling pathway or actomyosin activity disaggregated DFCs. Embryos at the 512-cell stage were injected with rhoaN19 or dnrock2a mRNA or treated from 50% to 65% ES with blebbistatin, followed by probing sox17 expression at 65% ES. Representative DFC patterns are shown in dorsal view (D) with quantification in E. (F) Rescue of ephb4b-MO2-induced DFC dispersal by constitutively active RhoA (RhoaV14). One-cell-stage embryos were injected with ephb4b-MO2 alone, or re-injected at the 512-cell stage with different doses of rhoaV14 mRNA, and examined for sox17 expression at 75% ES, The ratios different classes (as shown in D) were calculated. (G) Model of Ephb4b/Efnb2b signaling regulation of DFC aggregation. EVL, envelope layer; MPs, mesodermal progenitors; YSL, yolk syncytial layer. See the Discussion for explanation. |
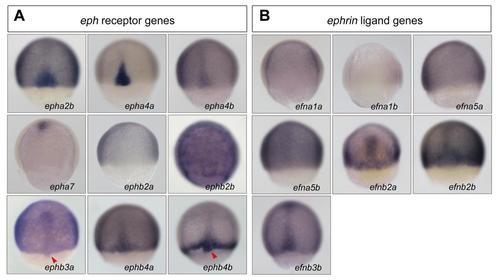
Expression patterns of Eph receptor and ligand genes in zebrafish gastrulas. Wild-type embryos were collected around 75% ES and probed with indicated gene probes. All embryos were dorsally viewed with animal pole to the top. Arrowheads indicated DFCs. |

Effectiveness test of ephb4b morpholinos. (A) Illustration of ephb4b mRNA and reporter structures. The approximate positions of two morpholinos, MO1 and MO2, were indicated. (B) Effect of MO injection on the reporter expression. 75 pg of the reporter plasmid pephb4b-5′UTR-GFP was injected alone or together with 20 ng ephb4b-MO1 or 10 ng ephb4b-MO2 into one-cell stage embryos. The injected embryos were observed at midgastrulation stages for GFP expression under a dissect fluorescence microscope. (C) Effect of ephb4b-MO2 on development. Embryos at the one-cell stage were injected with 10 ng ephb4b-MO2 or 10 ng cMO (standard control MO). The live embryos were observed at later stages as indicated. All embryos were orientated laterally. No severe abnormalities were found in ephb4b-MO2 injected embryos. |
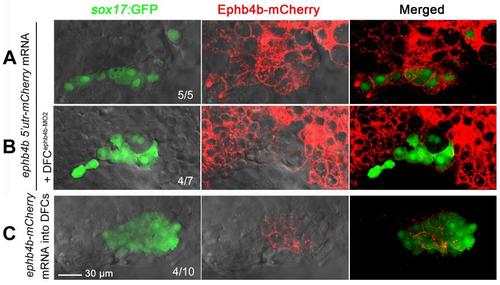
Efficiency of mRNA and morpholino injection at midblastulation stages. (A,B) Injection of 250 pg ephb4b 5′utr-mCherry fusion mRNA, which contained 5′ untranslated sequence including the ephb4b-MO2 binding site, into one-cell Tg(sox17:GFP) transgenic embryos led to global expression of mCherry including DFCs. When Tg(sox17:GFP) embryos were first injected with 250 pg ephb4b 5′utr-mCherry mRNA at the one-cell stage and then injected with 10 ng ephb4b-MO2 at the 512-cell stage, mCherry in GFP-positive DFCs was drastically reduced while it was retained in surrounding cells, suggesting that ephb4b-MO2 was restricted to DFCs. (C) Injection of 400 pg ephb4b-mCherry mRNA, which contains full-length ephb4b coding sequence, into 256-cell to 512-cell Tg(sox17:GFP) embryos led to mCherry expression specifically in DFCs. All of injected embryos were observed by confocal microscopy focusing on the DFC region at the 75% epiboly stage. The ratio of embryos with representative pattern was indicated. Scale bar: 30 µm. |
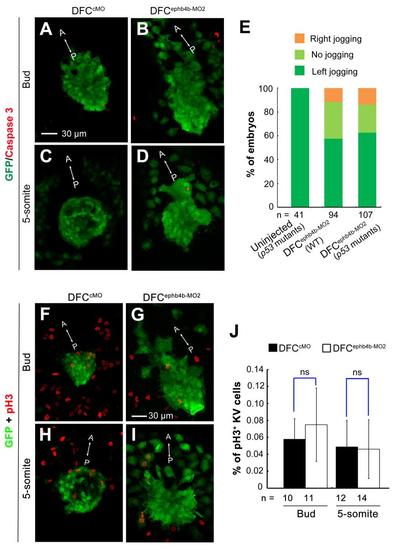
Effect of ephb4b knockdown on DFCs clustering and KV are unrelated to apoptosis or defective cell proliferation. (A-D) Effect of ephb4b knockdown on apoptosis of DFCs and KV cells. 10 ng cMO or ephb4b-MO2 was injected into the yolk of Tg (sox17: GFP) transgenic embryos at the 512-cell stage and harvested at the bud stage (A,B) and the 5-somite stage (C,D) for immunostaining using anti-GFP and anti-(active) Caspase 3 antibodies. The signal of active Caspase 3 was hardly detected in KV of either wild-type embryos (A,C) or ephb4b morphants (B,D). (E) Effect of ephb4b knockdown on heart jogging in wild-type or tp53-/- mutant embryos. 10 ng ephb4b-MO2 was injected into wild-type (WT) or p53-/- mutant embryos at the one-cell stage. The embryos were collected at 28 hpf for probing cmlc2 expression in the heart. The ratio of embryos for each category of heart jogging was calculated. (F-J) Effect of ephb4b knockdown on DFCs and KV cells proliferation. 10 ng cMO or ephb4b-MO2 was injected into the yolk of Tg (sox17: GFP) transgenic embryos at the 512-cell stage and harvested at the bud stage (F,G) and the 5-somite stage (H,I) for immunostaining using anti-GFP and anti-pH3 antibodies. The immunostained embryos were observed by confocal microscopy. The anterior (A)-posterior (P) axis was indicated. The proportion of pH3-positive KV cells was calculated (J). n, the number of observed embryos. ns, statistically non-significant at P > 0.05%. Scale bar: 30 µm. |
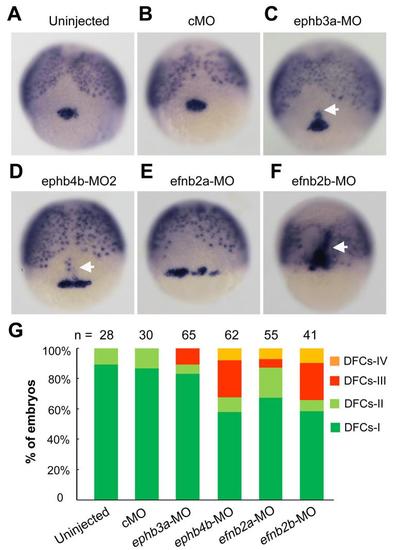
Comparison of knockdown effects of different eph/ephrin genes on DFCs aggregation. (A-F) Representative DFCs patterns in morphants. Embryos were injected with individual morpholinos at the one-cell stage and fixed at the 75% epiboly stage for probing sox17 expression. Embryos were dorsally viewed. White arrows indicated presumably involuted DFCs-derived cells. MO doses: cMO, 10 ng; ephb3a-MO, 10 ng; ephb4b-MO2, 10 ng; efnb2a-MO, 10 ng; efnb2b-MO, 7 ng. (G)The ratios of embryos with different DFCs patterns (See Fig. 2N) were shown. n, the number of observed embryos. |
DFCs involute or migrate away from the original cluster in ephb4b mutants. Embryos derived from crosses of ephb4b+/-;Tg(sox17:GFP) fish were injected with CAAX-mCherry mRNA at the one-cell stage to label cell membrane and observed by confocal microscopy from 60% ES to about 80% ES. At the end of observation, each embryo was genotyped. (A) Time-lapse dynamic observation of DFCs (green) in a WT sibling embryo in a time window indicated. Upper, multi-focal plane image series in dorsal view; lower, 3-D reconstituted image series in lateral view (same for (B) and (C)). The interface between DFCs and axial mesodermal precursors was indicated by an arrowhead. (B) Time-lapse dynamic observation of DFCs in a mutant embryo. The arrowhead indicated an involuting DFC. (C) Time-lapse dynamic observation of DFCs in a mutant embryo showing run-away and involution of DFCs. Three recognizable DFCs (d1-d3) and one axial mesodermal precursor were labeled if possible. Note that the cell m1 could not be recognized in the shown multi-focal and 3-D images. The cells d1 and d2 was eventually separated by m1. Also see Movie S3 and S4. |

Effectiveness test of efnb2b and efnb2a morpholinos. (A) Illustration of efnb2b mRNA and reporter structures. The approximate positions of two morpholinos, MO1 and MO2, were indicated. (B) Effect of MO injection on the reporter expression. 75 pg of the reporter plasmid pefnb2b-5′UTR-GFP was injected alone or together with 10 ng efnb2b-MO1 or 7 ng efnb2b-MO2 into one-cell stage embryos. The injected embryos were observed at midgastrulation stages for GFP expression under a dissect fluorescence microscope. (C) Effect of efnb2b-MO2 on development. Embryos at the one-cell stage were injected with 7 ng efnb2b-MO2 or 7 ng cMO. The live embryos were observed at later stages as indicated. All embryos were orientated laterally. Embryos injected with efnb2b-MO developed slower than those injected with cMO. (D) Effect of efnb2a knockdown on Efnb2a protein level. Embryos were injected with a morpholino or mRNA species at the one-cell stage and harvested at the 60% epiboly stage for Western blotting using different antibodies. Note that anti-Efnb2 appears to only recognize Efnb2a protein. |
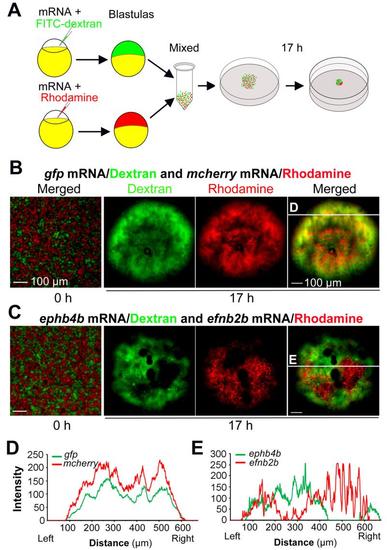
Ephb4b-expressing cells and efnb2b-expressing cells are mutually repulsive. (A) Scheme of hanging drop cell culture experiment. (B-E) Distribution of differently treated cells in hanging culture. Embryos were injected with indicated mRNA species and dye. For each mix, 5 drops were individually incubated. And three independent experiments were performed. The showed were examples. Differently labeled cells were well intermingled at the initial time-point (0 h) of incubation. The red and green fluorescence intensities at different positions along the line shown in (B) and (C) were depicted in (D) and (E) respectively. Note that two curves in the control group were in parallel while two curves representing ephb4b- or efnb2b-expressing cells were mutually exclusive. Scale bars: 100 µm. |

ephb4b requirement for RhoA activation and MLC2 phosphorylation at the DFCs boundary. (A) ephb4b requirement for RhoA activation at the DFCs boundary. 100 pg GST-rhotekin-RBD mRNA was injected into Tg(sox17:GFP) embryos at the one-cell stage to label active RhoA (GTP-RhoA), followed by injection with 10 ng cMO or ephb4b-MO2 injection. Embryos were collected at 75% ES for immunofluorescence staining. GST-Rhotekin-RBD (red) protein was enriched at the DFCs (green) boundary (indicated by arrows) in control embryos but not in ephb4b morphants. The ratio of embryos with the representative pattern was indicated. (B) ephb4b requirement for MLC2 phosphorylation at the DFCs boundary. Tg(sox17:GFP) embryos were injected with 10 cMO or ephb4b-MO2 at the one-cell stage and collected at 75% ES for immunofluorescence with anti-p-MLC2 (red) and anti-GFP antibodies. |