
Image
|
Figure Caption
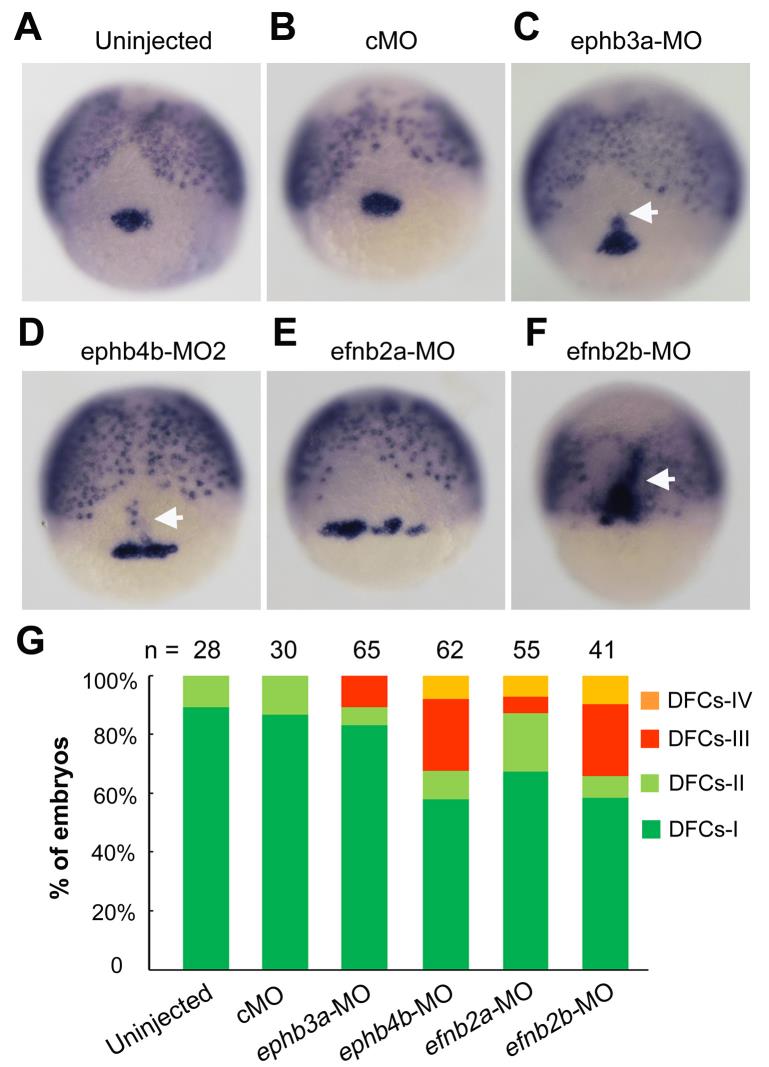
Fig. S5
Comparison of knockdown effects of different eph/ephrin genes on DFCs aggregation. (A-F) Representative DFCs patterns in morphants. Embryos were injected with individual morpholinos at the one-cell stage and fixed at the 75% epiboly stage for probing sox17 expression. Embryos were dorsally viewed. White arrows indicated presumably involuted DFCs-derived cells. MO doses: cMO, 10 ng; ephb3a-MO, 10 ng; ephb4b-MO2, 10 ng; efnb2a-MO, 10 ng; efnb2b-MO, 7 ng. (G)The ratios of embryos with different DFCs patterns (See Fig. 2N) were shown. n, the number of observed embryos.
Acknowledgments
This image is the copyrighted work of the attributed author or publisher, and
ZFIN has permission only to display this image to its users.
Additional permissions should be obtained from the applicable author or publisher of the image.
Full text @ Development