
- Title
-
Melanosomes in pigmented epithelia maintain eye lens transparency during zebrafish embryonic development
- Authors
- Takamiya, M., Xu, F., Suhonen, H., Gourain, V., Yang, L., Ho, N.Y., Helfen, L., Schröck, A., Etard, C., Grabher, C., Rastegar, S., Schlunck, G., Reinhard, T., Baumbach, T., Strähle, U.
- Source
- Full text @ Sci. Rep.
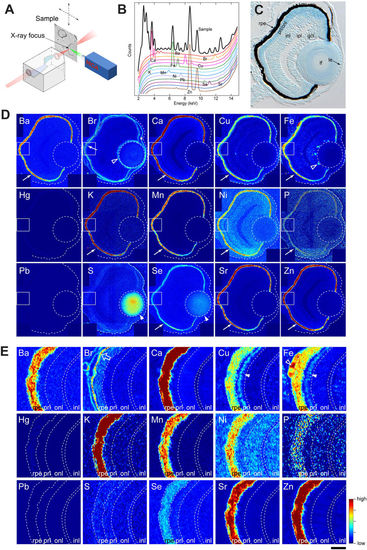
Distribution of inorganic elements in the eye of zebrafish embryos. (A) Illustration of μ-XRF imaging setup. The beam is generated in the synchrotron using an undulator source. The focusing optics is a Kirkpatrick-Baez (KB) mirror system, consisting of a pair of elliptically bent mirrors. The distance from the source to the KB is about 60 m, and from the KB to the focus about 0.18 m, allowing the incoming radiation to be focused into a sub-100 nm spot. The sample is scanned in the focal spot, and the fluorescence radiation is collected using an energy sensitive silicon drift diode and a multi channel analyser (MCA). (B) An example of a fluorescence spectrum recorded from the sample (black) overlaid with standard spectra from individual elements. Elements emit X-rays at energies that are characteristic to the given element, allowing the elements in the sample to be identified based on the peak locations. The spectrum shown here is a sum of spectrums from individual pixels covering about one quarter of the eye. (C) Toluidine blue-stained transverse 10-μm thick EPON section of 3-dpf zebrafish eye. rpe: retinal pigment epithelium, prl/onl: photo-receptor layer/outer nuclear layer, inl: inner nuclear layer, ipl: inner plexiform layer, gcl: ganglion cell layer, lf: lens fibre, le: lens epithelium. (D) Localization of elements in the eye of a 3-dpf embryo. Most elements are enriched in the RPE (arrows). Note that sulphur and selenium are also highly abundant in the lens fibre (arrow head). Stippled circle indicates the lens. The outline of the eye is given in a stippled line. Rectangular area denotes the region shown in the panel E. (E) Magnified view of the retinal area close to the RPE. The open arrow for Br points out the extracellular matrix. Step size: (D,E) 300 nm/pixel. Scale bars: (C) 26.5 μm (D) 30 μm; (E) 6 μm. Colour scale: Ba, 4–150 ppm; Br, 0–10 ppm; Ca, 10–3,000 ppm; Cu, 1–15 ppm; Fe, 2–80 ppm; Hg, 2–30 ppm; K, 20–300 ppm; Mn, 3–30 ppm; Ni, 0–7 ppm; P, 100,000–200,000 ppm; Pb, 0–200 ppm; S, 10,000–50,000 ppm; Se, 0–9 ppm; Sr, 1–50 ppm; Zn, 3–500 ppm. |
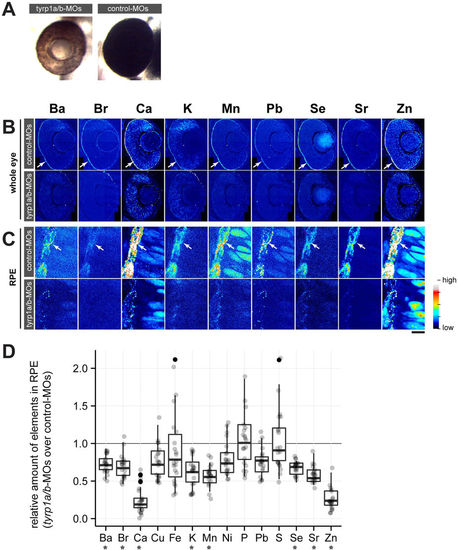
Mature melanosomes are required for enrichment of inorganic elements in the RPE. (A) Morpholino oligonucleotide (MO)-mediated knockdown of Tyrp1a/b results in the absence of mature melanosomes (brown colour of RPE) at 2 dpf, while control-MO injected embryos form mature melanosomes (black colour of RPE). (B) Distribution of inorganic elements in the eye of 2 dpf embryos injected with control (control-MOs, upper row) or tyrp1a/b-MOs (tyrp1a/b-MOs, lower row). The RPE enrichment of elements (arrow) seen in control-MO injected embryos is not observed in tyrp1a/b-MO injected embryos (n = 3 for each group). Step size: 300 nm/pixel. (C) Images taken with high lateral resolution (100 nm/pixel) showing inorganic element enrichment in individual melanosomes in the RPE (arrow) of embryos injected with control-MOs (upper row). This enrichment is not evident or strongly reduced in tyrp1a/b-knockdown embryos (lower row). Colour scale: Ba 10.0–132.5 ppm; Br 0.1–6.5 ppm; Ca 0–1152 ppm; K 0–623.3 ppm; Mn 0.3–19.6 ppm; Pb 0.7–10.8 ppm; Se 0.3–4.6 ppm; Sr 0.3–19.6 ppm; Zn 0–152.9 ppm. Scale bars: (A,B) 50 μm; (C) 5 μm. (D) The content of each element in the RPE was shown as the ratio of tyrp1a/b morphants to control embryos, with all possible combinations between control MO-injected embryos (n = 4 embryos) and tyrp1a/b MO-injected (n = 5 embryos). Abundance of eight elements (Ba, Br, Ca, K, Mn, Se, Sr and Zn) showed significant reduction in the RPE after knockdown of tyrp1a/b (Mann–Whitney U test; U = 0, *p = 0.0158 for Ba, Ca, K, Mn, Sr and Zn; U = 1, *p = 0.0365 for Br; U = 0, *p = 0.0194 for Se). PHENOTYPE:
|
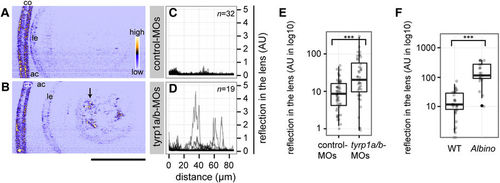
Absence of mature melanosomes sensitizes the lens fibre to cataract formation. (A,B) Confocal reflection imaging on the lenses at 4 dpf of living embryos injected with either control-MOs (A) or tyrp1a/b-MOs (B). The anterior chamber (ac) is oriented to the left. co: cornea. le: lens epithelium. Scale bar: 50 μm. The arrow in panel B points out abnormal lens reflection observed after tyrp1a/b-knockdown. (C,D) Lenticular reflection profiles as a function of distance from the anterior edge of the lens capsule (lc) toward the posterior end of the lens for control-MO injected embryos (C) and tyrp1a/b-MO injected embryos (D). The intensity of reflection is shown in an arbitrary unit (AU). The number of examined individuals for each group is shown in the upper right corner. Profiles from the individual embryos were overlaid. (E,F) Quantification of abnormal lens reflections. Welch two sample t-test and Mann-Whitney U test showed significant differences between control-MOs (n = 51 embryos) and tyrp1a/b-MO injections (n = 40 embryos; (E) ***p = 8.74 × 10⁻⁴, t = 3.5896), and between wild type embryos (WT, n = 29 embryos) and albino (slc45a2) homozygous embryos (n = 19 embryos; (F) ***p = 1.52 × 10⁻⁷, U = 26), respectively. PHENOTYPE:
|
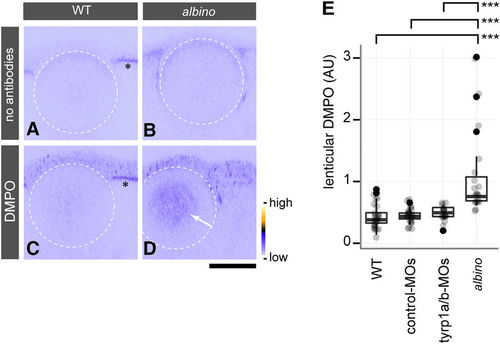
The cataractous lens in albino mutants shows lens protein radicals caused by oxidative stress. (A–D) In situ DMPO adduct distribution in the eye of wild type (WT) (A,C) and albino homozygous mutants (B,D) at 4 dpf. The white stippled circles outline the lens. albino homozygous mutants show abnormal DMPO adducts in the nucleus of the lens (D, arrow), visualised by staining with an anti-DMPO antibody and a fluorescent secondary antibody, whereas this staining is absent from the lens of WT embryos (C). The panels (A,B) show images obtained with the staining solutions lacking antibodies for WT and albino embryos, respectively. Asterisks (A,C) indicate the autofluorescence observed in the RPE of WT. The colour ramp next to panel (D) denotes the fluorescent signal intensity for DMPO adducts. Scale bars: 50 μm. (E) Quantification of DMPO adducts in the lens. One-way ANOVA showed significant differences (F[3, 78] = 15.674, p = 4.54 × 10⁻⁸) between albino homozygous mutants (n = 19 embryos), un-injected WT (n = 24 embryos), and WT embryos injected with control-MOs (n = 22 embryos) or tyrp1a/b-MOs (n = 17 embryos). A significant increase of DMPO adducts was observed in the lenses of albino mutants in comparison to all other conditions (Tukey HSD test; ***p = 3.0 × 10⁻⁷ for WT vs. albino; ***p = 8.0 × 10⁻⁷ for control MO-injected WT vs. albino; ***p = 2.02 × 10⁻⁵ for tyrp1a/b MO-injected WT vs. albino). PHENOTYPE:
|
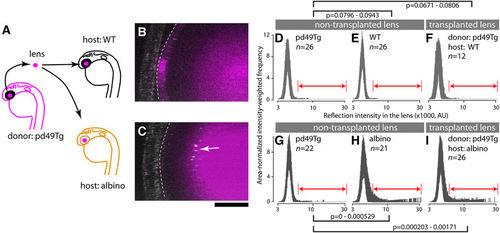
A wildtype lens develops cataract when transplanted into a slc45a2 (albino) mutant background. (A) Lens transplantation scheme. The lens derived from a transgenic wildtype line pd49Tg was used as a donor allowing identification of the slc45a2+/+ lens by expression of RFP after transplantation into mutant (albino) and wildtype (WT) host embryos. Lens transplantation was performed among stage matched donor and host embryos during 26–30 hpf. The endogenous host lens was completely removed and replaced with pd49Tg donor lens. Embryos transplanted with pd49Tg donor lenses were raised in the dark and the presence of abnormal lens reflection was examined at 4 dpf. (B,C) The stippled line demarcates the transplanted pd49Tg donor lens identified by the presence of RFP fluorescence reporter (magenta). The reflection channel is merged in gray. Note the presence of abnormal lens reflection in the transplanted lens when host embryos are slc45a2/albino mutants. The anterior chamber is oriented to the left. Scale bar: 20 μm. (D–I) Reflection signal distribution in the lens of each group is shown as a function of the reflection intensity value (x-axis; x1000, log10 scale in AU) with intensity-weighted frequency (y-axis; the product of intensity and frequency, normalized for area). The number of embryos for each group is given in each panel. Results are shown as a set of two independent experiments (D–F and G–I), each composed of donor pd49Tg non-transplanted lens (D,G), non-transplanted lens in the host (wildtype [E] and albino [H]), and the transplanted donor pd49Tg lens in WT host (F) and albino host (I). A range of reflection signals indicated by double-headed arrows (red) were considered as abnormal and used for permutation tests. 99% confidence interval of p-values is given for each indicated pair. |
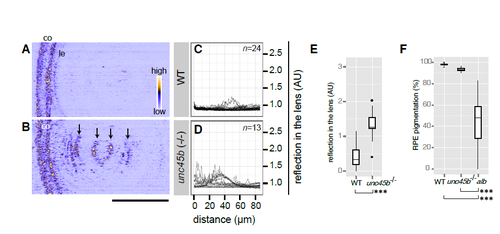
Zebrafish unc45b homozygous mutants show lens cataract (A-B) Analysis of lens phenotype at 4 dpf by confocal reflection imaging of living wildtype embryos (WT, A) and homozygous unc45b mutants (unc45b-/-, B) raised in fish water. Anterior chamber is oriented to left. co: cornea. le: lens epithelium. The intensity of reflection is colourcoded as shown in the panel A. Abnormal lens reflections were observed with unc45b homozygous mutant embryos (arrows, B). Scale bar: 50 μm. (C-D) Lenticular reflection profiles as a function of distance from the anterior edge of the lens epithelium (le) toward the posterior end of the lens are shown for WT (C) and unc45b-/- mutants (D). The intensity of reflection is shown in an arbitrary unit (AU). The number of examined individuals for each group is shown in the upper right corner. Profiles from individual embryos were overlaid. (E) unc45b-/- mutants (n=15 embryos) show significantly increased lens reflection compared to WT (n=23 embryos; Welch two sample t-test; t=-1.937, ***p=2.61 x10⁻¹¹). (F) RPE pigmentation was quantified by measuring transmission light through the eyes of WT embryos (n=25 embryos), unc45b-/- mutant embryos (n=10 embryos) and albino (slc45a2) homozygous embryos (n=69 embryos). One-way ANOVA revealed significant differences among three genotypes (F[2, 66]=119, p<2.2 x10⁻¹⁶). Significant differences were observed with albino mutants in comparison to WT or unc45b-/- mutants (Tukey HSD test; ***p<2.2 x10⁻¹⁶). No significant change was observed with the pigmentation status of RPE between wildtype and unc45b mutant eyes (Tukey HSD test, p=0.667). |