
Fig. 1
- ID
- ZDB-FIG-170608-20
- Publication
- Takamiya et al., 2016 - Melanosomes in pigmented epithelia maintain eye lens transparency during zebrafish embryonic development
- Other Figures
- All Figure Page
- Back to All Figure Page
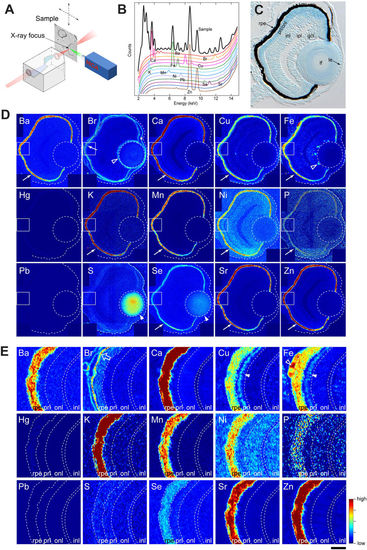
Distribution of inorganic elements in the eye of zebrafish embryos. (A) Illustration of μ-XRF imaging setup. The beam is generated in the synchrotron using an undulator source. The focusing optics is a Kirkpatrick-Baez (KB) mirror system, consisting of a pair of elliptically bent mirrors. The distance from the source to the KB is about 60 m, and from the KB to the focus about 0.18 m, allowing the incoming radiation to be focused into a sub-100 nm spot. The sample is scanned in the focal spot, and the fluorescence radiation is collected using an energy sensitive silicon drift diode and a multi channel analyser (MCA). (B) An example of a fluorescence spectrum recorded from the sample (black) overlaid with standard spectra from individual elements. Elements emit X-rays at energies that are characteristic to the given element, allowing the elements in the sample to be identified based on the peak locations. The spectrum shown here is a sum of spectrums from individual pixels covering about one quarter of the eye. (C) Toluidine blue-stained transverse 10-μm thick EPON section of 3-dpf zebrafish eye. rpe: retinal pigment epithelium, prl/onl: photo-receptor layer/outer nuclear layer, inl: inner nuclear layer, ipl: inner plexiform layer, gcl: ganglion cell layer, lf: lens fibre, le: lens epithelium. (D) Localization of elements in the eye of a 3-dpf embryo. Most elements are enriched in the RPE (arrows). Note that sulphur and selenium are also highly abundant in the lens fibre (arrow head). Stippled circle indicates the lens. The outline of the eye is given in a stippled line. Rectangular area denotes the region shown in the panel E. (E) Magnified view of the retinal area close to the RPE. The open arrow for Br points out the extracellular matrix. Step size: (D,E) 300 nm/pixel. Scale bars: (C) 26.5 μm (D) 30 μm; (E) 6 μm. Colour scale: Ba, 4–150 ppm; Br, 0–10 ppm; Ca, 10–3,000 ppm; Cu, 1–15 ppm; Fe, 2–80 ppm; Hg, 2–30 ppm; K, 20–300 ppm; Mn, 3–30 ppm; Ni, 0–7 ppm; P, 100,000–200,000 ppm; Pb, 0–200 ppm; S, 10,000–50,000 ppm; Se, 0–9 ppm; Sr, 1–50 ppm; Zn, 3–500 ppm. |