
- Title
-
Temporal and spatial expression of tight junction genes during zebrafish pronephros development
- Authors
- McKee, R., Gerlach, G.F., Jou, J., Cheng, C.N., Wingert, R.A.
- Source
- Full text @ Gene Expr. Patterns
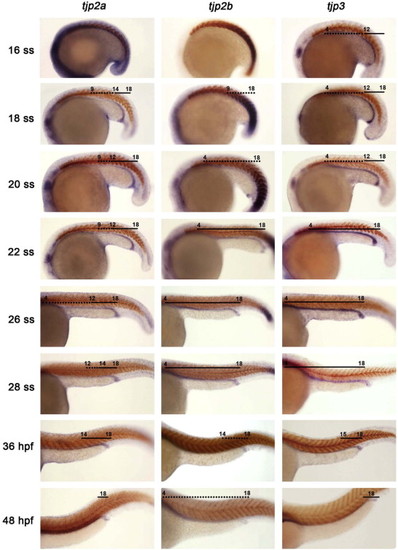
Expression of tjp transcripts during nephrogenesis. Whole mount in situ hybridization analysis for tjp2a, tjp2b, and tjp3 (purple) and smyhc1 (red) at the 16–28 somite stage (ss), 36 and 48 hours post fertilization (hpf) in wild-type embryos. Embryos are shown in lateral views with anterior to the left. Black lines (strong expression) and dotted lines (faint expression) indicated transcript domains and comparative levels, and numbers correspond to the somite position of nephron cells. For interpretation of the references to color in this figure legend, the reader is referred to the web version of this article. EXPRESSION / LABELING:
|
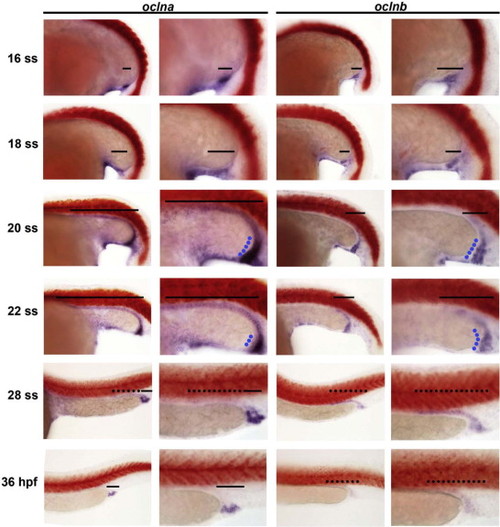
Expression of ocln transcripts during nephrogenesis. Whole mount in situ hybridization analysis for oclna and oclnb (purple) and smyhc1 (red) at the 16–28 somite stage (ss), 36 and 48 hours post fertilization (hpf) in wild-type embryos. Embryos are shown in lateral views with anterior to the left. Black lines (indicating strong expression) and black dotted lines (indicating weak/low-level expression) demarcate transcript domains within the pronephros (PCT, PST, DE, DL, and PD), while blue dotted lines indicate the intense pronephros PD expression noted at particular time points. For interpretation of the references to color in this figure legend, the reader is referred to the web version of this article. EXPRESSION / LABELING:
|
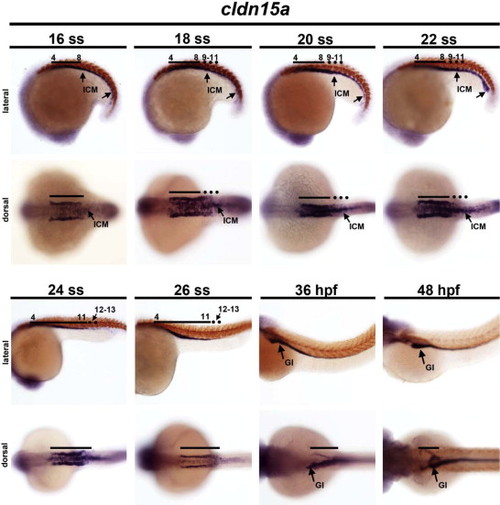
Expression of cldn15a transcripts during nephrogenesis. Whole mount in situ hybridization analysis for clnd15a (purple) and smyhc1 (red) at the 16–28 somite stage (ss), 36 and 48 hours post fertilization (hpf) in wild-type embryos. Embryos are shown in lateral views with anterior to the left. Black lines (strong expression) and dotted lines (faint expression) indicated transcript domains and comparative levels, and numbers correspond to the somite position of nephron cells. Abbreviations: inner cell mass (ICM) denotes primitive blood, and gastrointestinal tract (GI). For interpretation of the references to color in this figure legend, the reader is referred to the web version of this article. EXPRESSION / LABELING:
|

Expression of cldn8 transcripts during nephrogenesis. Whole mount in situ hybridization analysis for clnd8 (purple) and smyhc1 (red) at the 16–28 somite stage (ss), 36 and 48 hours post fertilization (hpf) in wild-type embryos. Embryos are shown in lateral views with anterior to the left. Black lines (strong expression) and dotted lines (faint expression) indicated transcript domains and comparative levels, and numbers correspond to the somite position of nephron cells. For interpretation of the references to color in this figure legend, the reader is referred to the web version of this article. EXPRESSION / LABELING:
|
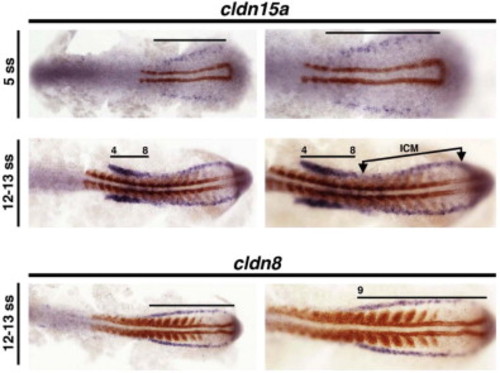
Renal progenitor expression domains of cldn15a and cldn8. Whole mount in situ hybridization analysis for clnd15a (purple) and myod1 (red) at the 5–13 somite stage (ss) in wild-type embryos. Embryos are shown in dorsal view, flat-mounted, with anterior to the left. Black lines indicated transcript domains, and numbers correspond to the somite position of nephron cells. Abbreviations: inner cell mass (ICM) denotes primitive blood. For interpretation of the references to color in this figure legend, the reader is referred to the web version of this article. EXPRESSION / LABELING:
|
Reprinted from Gene expression patterns : GEP, 16, McKee, R., Gerlach, G.F., Jou, J., Cheng, C.N., Wingert, R.A., Temporal and spatial expression of tight junction genes during zebrafish pronephros development, 104-113, Copyright (2014) with permission from Elsevier. Full text @ Gene Expr. Patterns