
- Title
-
Acetylcholine serves as a derepressor in Loperamide-induced Opioid-Induced Bowel Dysfunction (OIBD) in zebrafish
- Authors
- Shi, Y., Zhang, Y., Zhao, F., Ruan, H., Huang, H., Luo, L., Li, L.
- Source
- Full text @ Sci. Rep.

(a1–d1) DCFH-DA reveals the gut lumen formation process at 2–4.5 dpf in the lateral view. (a2–d2) The dorsal view of the pattern of a1–d1 at 2–4.5 dpf. The red arrows in a1–d2 represent the intestinal lumen formation processes, which initially show a dashed line pattern (boxed region in a1–b1, red arrows in a2) at 2 dpf and merge thereafter. The red arrowheads in a1 to d2 indicate the formation of the intestine bulb from 2 dpf, which increases in size at 2.5 dpf (b1 and b2), 3.5 dpf (c1 and c2) and 4.5 dpf (d1 and d2). (e1–f4) The staining patterns of DCFH-DA at later stages, 5 dpf (e1–e4) and 6 dpf (f1–f4). e1–e2 are lateral with regard to the gut after staining, and e2 is the image of e1 merged with DIC. The blue arrows in e1 and e2 indicate that the dye marks the pronephric ducts in addition to the gut lumen, as indicated by red arrows. e3–e4 shows the dorsal view of the pattern, which indicates that the dye clearly labels the gallbladder (white arrows). e4 is the image of e3 merged with DIC. f1–f4 are the lateral views of the gut at 6 dpf, and f2 and f4 are the images of f1 and f3 merged with DIC. f3 and f4 are high magnifications of the boxed images in f1 and f2. The white arrowheads in f3 and f4 indicate the folding of the gut epithelium during the formation of crypt-like architecture. (g–h) The dye emitting from the mouth (g) and anus (h). The red arrows represent the circular signals of the emitting dye under the GFP channel. |

(a) The staining patterns of almarBlue reveal the gut lumen (white arrowheads) and circulating blood cells (white arrows) at 2–6 dpf in the lateral view. (b) Green signals are universally detected in Tg(actb2:HyPer)pku326 before 3 dpf, and the signals enhance in the intestinal epithelial cells at 6 dpf (white arrows). (c) RT-PCR reveal the efficient block of duox transcript splicing via MO mediated genetic knockdown. (d) The signals of the ROS/redox probes reduce, but not exclusively disappear, in the intestinal tract after duox is genetic knockdown by MO. White arrowheads indicate the signals in the intestinal tract. |
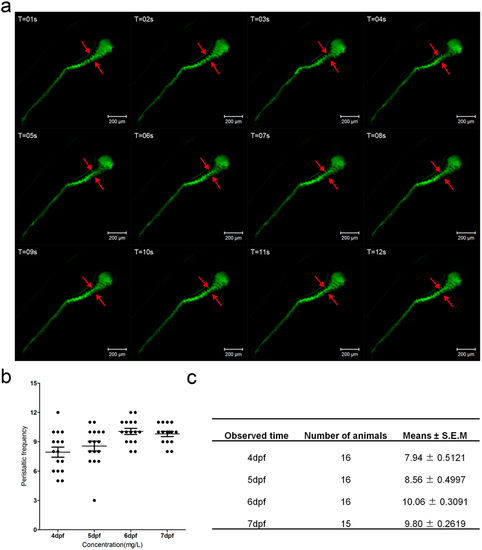
(a) The fragments from the live image (supplement video 2) reveal the gut peristalsis process at 6 dpf larvae fish by DCFH-DA staining, which clearly shows the invaginations of the intestinal bulb epithelium (marked by red arrows). The folding events could serve as an indicator of intestinal movement frequency. (b) Quantification data of the movement frequency at different stages. (c) The table describing the detailed data of b. |
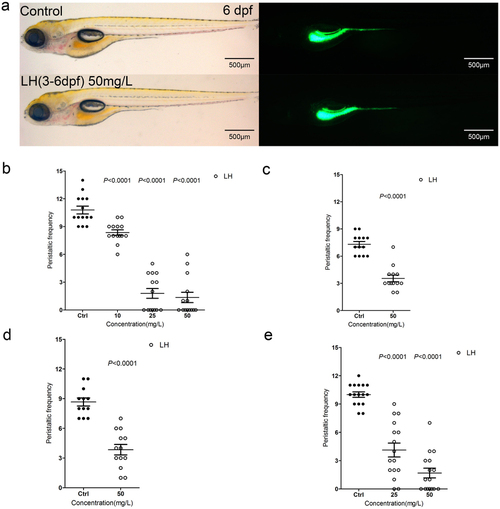
(a) The fish do not show obvious developmental abnormality after treatment of LH for even 3 days compared with control fish. Left panels are in bright field (BF) channel whereas right are in GFP channel. (b) The calculation data uncover the intestinal peristalsis frequency at 6 dpf after application of LH for 3 days. (c–e) The calculation data indicate the effect of LH on gut peristalsis at 4 dpf (c), 5 dpf (d) and 6 dpf (e) after treatment for 12 hours. P value is statistical with corresponding control. |
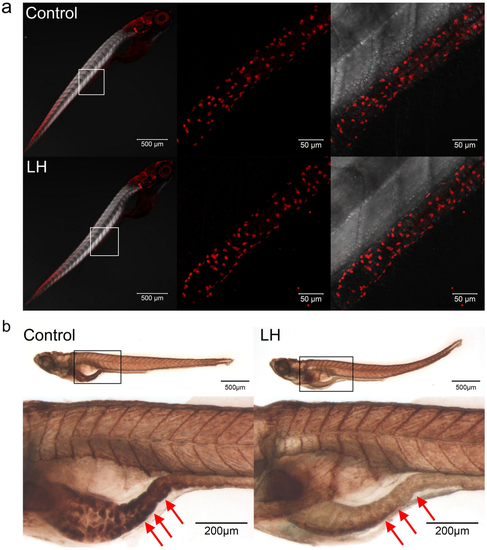
(a) Immunohistochemical staining of HuC/D in both control and LH-treated fish at 6 dpf. The data show no significant difference between the control and chemical application groups. Left panels show the whole body staining pattern of HuC/D, whereas middle and right panels represent high magnifications of the areas that are boxed in left. Right panels are the images of middle merged with DIC. (b) The AChE activity detection assay reveal that AChE activity is significantly reduced after LH treatment (right panels) compared with control (left panels) in the gut but not elsewhere in the body. Upper panels show the whole body staining pattern of Ache, whereas bottom panels represent high magnifications of the boxed images. The red arrows in b indicate the intestinal bulb region where peristalsis is identified. |
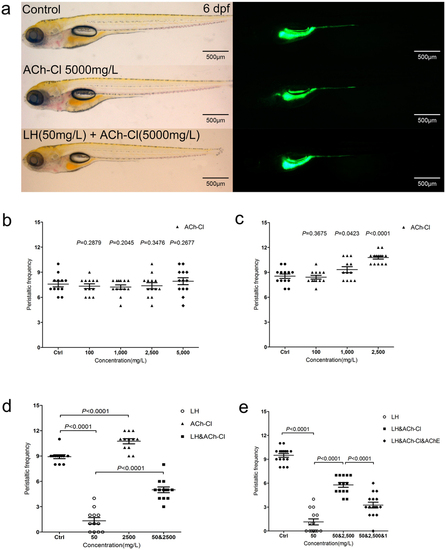
(a) The larval fish do not show an obvious developmental defect when treated by ACh-Cl and LH+ACh-Cl for 12 hours compared with control. Left panels are in the BF channel, whereas right are in the GFP channel. (b–c) Quantification data indicate that the effect of exogenous ACh-Cl on gut peristalsis at 4 dpf (b) and 6 dpf (c) after transit incubation for 10–30 minutes. 10, 100, 1000, 2500 and 5000 mg/L ACh-Cl had no influence on the gut movement frequency at 4 dpf (b), whereas 2500 mg/L promote the movement ability obviously at 6 dpf (c). (d) Quantification data show that treatment of exogenous ACh-Cl for 10–30 minutes partially rescue the inhibition phenotype of gut peristalsis caused by LH. (e) Quantification data show that acetylcholinesterase (AChE) inhibits the recovered phenotype by exogenous ACh-Cl. P value is statistical with corresponding control. PHENOTYPE:
|
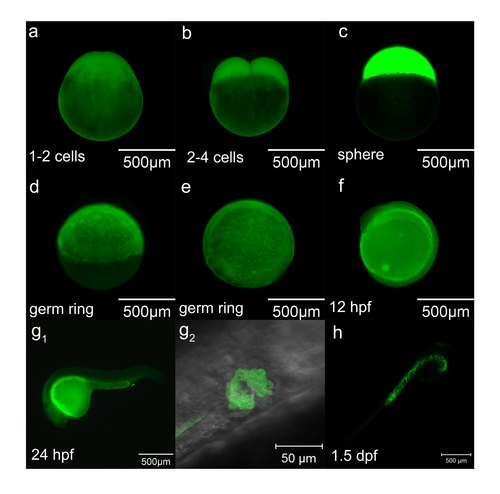
Staining pattern of DCFH-DA at early stages. (a-h) The staining pattern of DCFH-DA at different stages. g2 is the high magnification of boxed place in g1 from ventral-dorsal angle, which shows the opening of the pronephric ducts through cell apoptosis. |
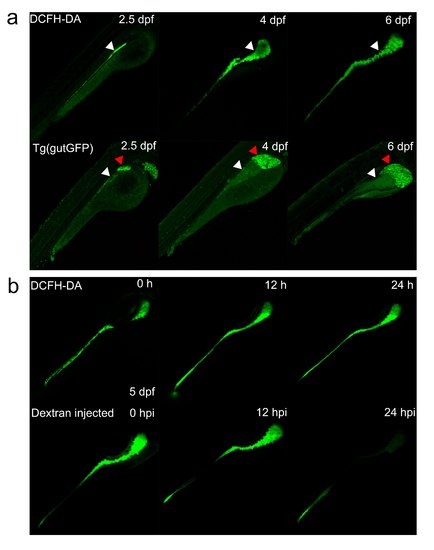
Comparison of different intestinal detection assays. (a) The reflection of intestine by DCFH-DA and Tg(gutGFP) at different stages. White arrowheads indicate the intestine tract, whereas red arrowheads represent the liver in Tg(gutGFP). (b) The intensity of signals decreases significantly with time after injection of Dextran into the intestine at 5 dpf. |
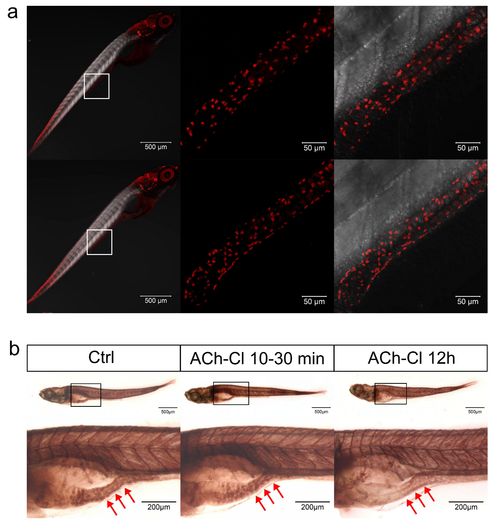
Effect of ACh-Cl on the AChE activity and ENS neuron development. (a) Immunohistochemical staining of HuC/D in both control and ACh-Cl treated fish at 6 dpf. The data show no significant difference between the control and chemical application groups. Left pannels show the whole body staining pattern of HuC/D whereas middle and right represent the high magnifications of the areas that boxed in left panels. Right panels are the images of middle merged with DIC. (b) The AChE activity detection assay reveals that the AChE activity does not show obvious difference (middle panels) after transit application of ACh-Cl but reduces obviously after ACh-Cl treatment for 12 hours (right panels) compared with control (left panels) in the gut but not elsewhere in the body. Upper panels show the whole body staining pattern of AChE whereas bottom panels represent the high magnifications of the boxed images correspondingly. The red arrows indicate the intestinal bulb region where the peristalsis is identified. |
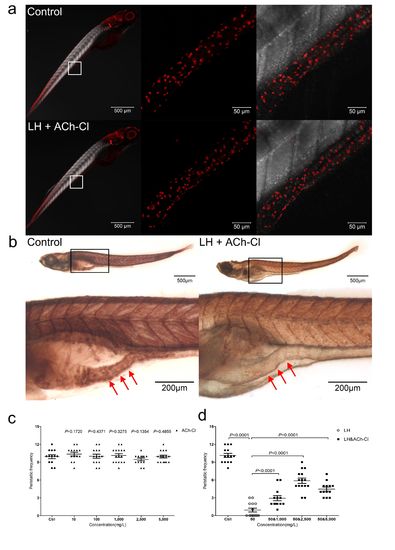
Effect of combination of ACh-Cl and LH on the gut AChE activity and ENS neuron development. (a1) Immunohistochemical staining of HuC/D in both control and LH+ACh-Cl treated fish at 6 dpf. The data show no significant difference between the control and chemical application groups. Left pannels show the whole body staining pattern of HuC/D whereas middle and right panels represent high magnifications of the areas that are boxed. Right panels were the images of middle merged with DIC. (b) The AChE activity detection assay reveal that the AChE activity is largely reduced after LH+ACh-Cl treatment compared with control in the gut but not elsewhere in the body. Upper panels show the whole body staining pattern of AChE whereas bottom represent high magnifications of the boxed images accordingly. The red arrows indicate the intestinal bulb region where the peristalsis is identified. (c) Quantification data indicate that there is no obvious promotion effect of exogenous ACh-Cl on gut peristalsis at 6 dpf after incubation for 12 hours with 10, 100, 1000, 2500 and 5000 mg/L. (d) Quantification data show that treatment of exogenous ACh-Cl for 12 hours partially rescue the inhibition phenotype of gut peristalsis caused by LH and the recovery effect is dosage dependent. |