
- Title
-
UBIAD1-mediated vitamin K2 synthesis is required for vascular endothelial cell survival and development
- Authors
- Hegarty, J.M., Yang, H., and Chi, N.C.
- Source
- Full text @ Development
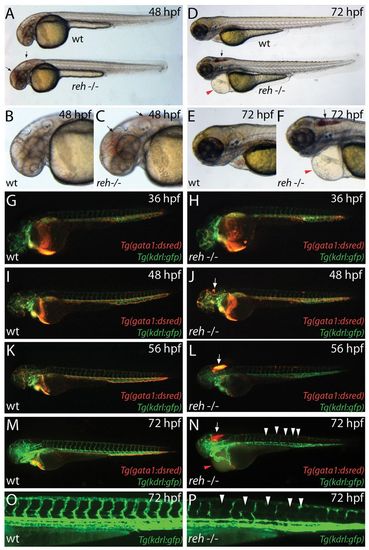
reddishs587 mutants exhibit cranial hemorrhage, degenerating vessels and pericardial edema. (A-F) Bright-field micrographs of wild-type (wt) and rehs587 mutant (reh-/-) embryos at (A-C) 48 hpf and (D-F) 72 hpf (A,C,D,F). Black arrows indicate cranial hemorrhage in reh mutant. Red arrowheads indicate pericardial edema. (G-N) Fluorescence micrographs of (G,I,K,M) wild-type (wt) and (H,J,L,N) rehs587 mutants (reh-/-) in Tg(gata1:dsRed);Tg(kdrl:GFP) background at (G,H) 36, (I,J) 48, (K,L) 56 and (M,N) 72 hpf. Cranial hemorrhage as detected by extravasation of Tg(gata1:dsRed) labeled blood in the head (white arrows) occurs in rehs587 mutants as early as (J) 48 hpf and increases during development (L,N). reh-/- intersegmental vessels appear to degenerate by 72 hpf (N, white arrowheads). (O,P) Tg(kdrl:GFP) (O) wild-type (wt) and (P) reh-/- intersegmental vessels confirm this degeneration in reh-/- mutants at 72 hpf (white arrowheads). Red arrowhead in N indicates pericardial edema. PHENOTYPE:
|
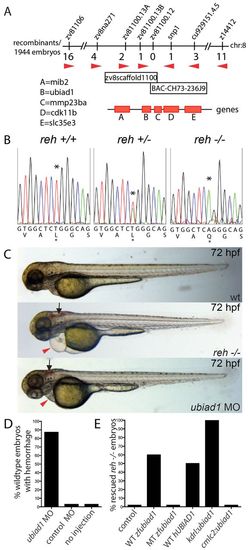
reh encodes UBIAD1. (A) Genetic map of the reh region. Numbers below SSLP markers indicate recombination events out of 1944 diploid embryos examined. The mapped reh critical region contains one BAC and one genomic scaffold. (B) Sequencing of ubiad1 cDNA revealed a T to A change at base pair 422 in the s587 mutant allele, resulting in a Leu-to-Gln substitution at residue 65. Black asterisk indicates the location of the mutation. (C,D) Eighty-seven percent of wild-type (wt) embryos injected with a ubiad1 splice morpholino exhibited cranial hemorrhage (black arrows) and mild cardiac edema (red arrowheads), but wild-type embryos injected with control morpholino displayed no discernible cardiovascular phenotypes. (E) Wild-type zebrafish ubiad1 (WT zfubiad1) mRNA, human UBIAD1 (WT hUBIAD1) mRNA and zebrafish kdrl:ubiad1 rescued the reh cardiac and vascular phenotype. However, neither zebrafish ubiad1s587 (MT zfubiad1) mRNA nor zebrafish cmlc2:ubiad1 could rescue either reh cardiovascular mutant phenotypes. PHENOTYPE:
|
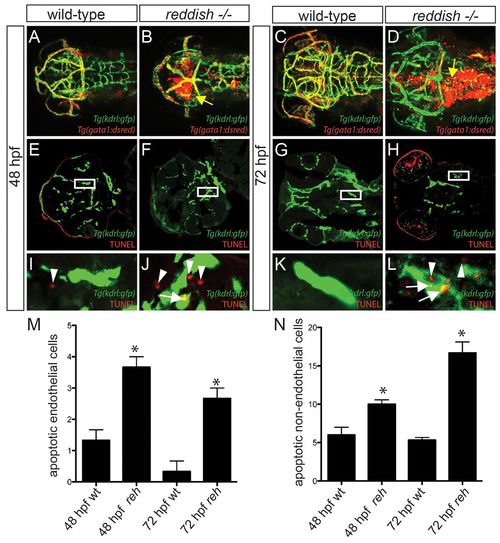
Vascular integrity and endothelial survival are compromised in reh mutants due to increased apoptosis. (A-D) Confocal projections of 48 and 72 hpf Tg(kdrl:gfp);Tg(gata1:dsRed) (A,C) wild-type or (B,D) reh mutant zebrafish. Yellow arrow indicates extravasation of Tg(gata1:dsRed)-labeled blood. (E-L) Confocal sections of 48 and 72 hpf Tg(kdrl:gfp) wild-type (wt) and reh mutant zebrafish that were TUNEL stained (red) reveal that (F,H,J,L) reh endothelial cells exhibit increased apoptosis when compared with (E,G,I,K) wild-type endothelial cells. (I-L) Enlargements of boxed areas in E-H, respectively, show (J) increased cell death in not only reh endothelial cells (white arrows) but also in (L) cells surrounding these reh endothelial cells (white arrowheads) when compared with wild-type vasculature. (M,N) The number of apoptotic cells observed per high-power field for each condition. Mean+s.e.m. Student’s t-test, *P<0.05 (n=15 reh and wild-type zebrafish). PHENOTYPE:
|
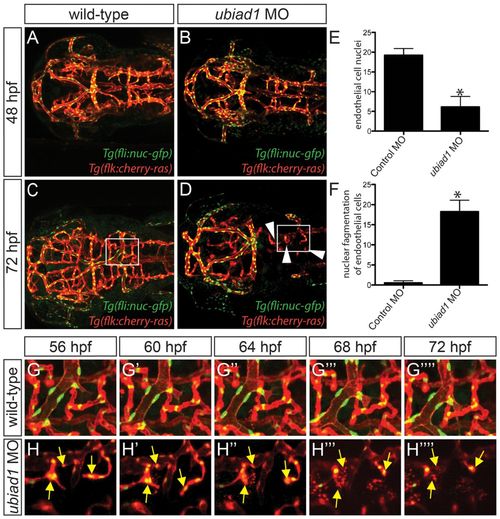
Loss of ubiad1 function results in decreased cranial vasculature and endothelial cells due to increased endothelial karyorrhexis. (A-D) Confocal projections of 48 and 72 hpf Tg(fli1a:nEGFP);Tg(kdrl:cherry-ras) (A,C) control morpholino (MO) and (B,D) ubiad1 MO-injected zebrafish reveal that there are not only fewer reh endothelial cells but there is also an increase in nuclear fragmentation (karyorrhexis) in ubiad1 morpholino-injected zebrafish when compared with control-injected animals. Arrowheads indicate missing cranial vessels. (E) The number of endothelial nuclei is reduced in ubiad1 morpholino-injected zebrafish when compared with control morpholino-injected zebrafish. The number of endothelial nuclei observed per high-power field at 72 hpf. (F) An increase in the number of endothelial cells undergoing nuclear fragmentation was observed in ubiad1 morpholino-injected zebrafish when compared with control morpholino-injected zebrafish. The number of endothelial nuclei undergoing karyorrhexis per high-power field from 48 to 72 hpf. Mean+s.e.m. Student’s t-test, *P<0.05 (n=5). (G-H′′) Time-lapse imaging of boxed areas in C (G-G33) and D (H-H33) shows that endothelial nuclei from (H-H′′ ′′) ubiad1 morpholino-injected but not (G-G′′ ′′) control morpholino-injected zebrafish exhibit increased nuclear fragmentation, resulting in subsequent endothelial cell death. Yellow arrows indicate endothelial nuclei undergoing fragmentation. PHENOTYPE:
|
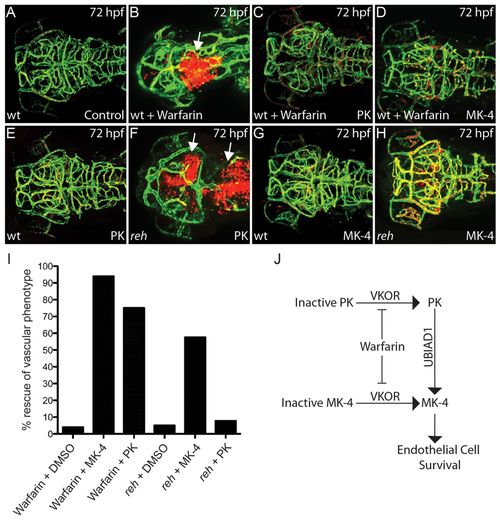
UBIAD1 regulates menaquinone/vitamin K2 metabolism to maintain cranial vasculature. (A,B) Confocal projections of (A) DMSO- and (B) warfarin-treated reh;Tg(gata1:dsRed);Tg(kdrl:GFP) zebrafish reveal that warfarin treatment of zebrafish at 24 hpf leads to cranial hemorrhages (white arrow) by 72 hpf. (C,D) PK (C) and MK-4 (D) treatment at 36 hpf can rescue this warfarin-induced cranial hemorrhaging and vascular defect. (E-H) Confocal projections of PK- and MK-4-treated reh;Tg(gata1:dsRed);Tg(kdrl:GFP) mutant zebrafish showed that (H) MK-4 but not (F) PK treatment at 36 hpf can rescue the reh vascular phenotype by 72 hpf. However, (E) PK and (G) MK-4 treatment had no discernible effect on wild-type zebrafish. Arrows in F indicate cranial hemorrhages. (I) MK-4 or PK treatment rescued the warfarin-induced cranial hemorrhage; however, MK-4 but not PK treatment rescued the reh cranial hemorrhage. (J) The relationship of vitamin K2/MK-4, vitamin K1/PK, UBIAD1 and warfarin. PHENOTYPE:
|
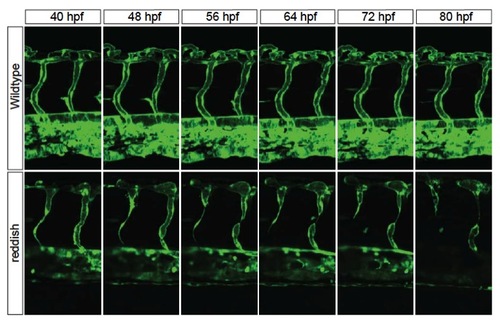
The reh mutant intersegmental vessels start degenerating at 48 hpf and become absent or atretic by 72 hpf. Time-lapse confocal imaging of Tg(kdrl:GFP) reh and wild-type vasculature between 40-80 hpf shows that reh intersegmental vessels begin to degenerate at 48 hpf and are either absent or atretic by 72 hpf, whereas wild-type intersegmental vessels remain patent during the same time period. Time interval is every 15 minutes. Representative images are shown every 8 hours. Top, dorsal longitudinal anastomotic vessel; bottom, dorsal aorta/cardinal vein. |

UBIAD1 is expressed in the heart and vasculature. (A) RT-PCR shows that UBIAD1 is expressed at the one-cell stage of zebrafish embryos. (B,C) Whole-mount RNA in situ hybridization reveals UBIAD1 expression in the heart and brain. UBIAD1 is expressed in (B) the brain from 24 to 72 hpf (black arrows) and (C) the heart by 36 hpf (red arrow). (D) RT-PCR shows that UBIAD1 is expressed in human umbilical vein endothelial cells (HUVEC) and human hearts. EXPRESSION / LABELING:
|

ZFIN is incorporating published figure images and captions as part of an ongoing project. Figures from some publications have not yet been curated, or are not available for display because of copyright restrictions. PHENOTYPE:
|
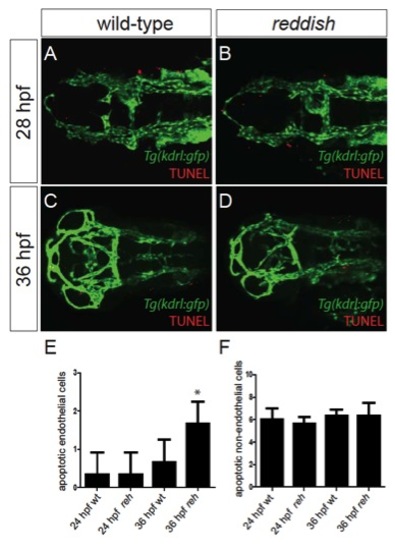
Endothelial survival is compromised in reh mutants owing to increased apoptosis by 36 hpf. (A-D) Confocal projections of Tg(kdrl:gfp) wild-type (wt) and reh mutant zebrafish that were TUNEL stained (red) reveal that (D) reh endothelial cells exhibit increased apoptosis at 36 hpf when compared with (C) wild-type endothelial cells. However, there appeared to be no significant difference in endothelial cell death between (A) wild-type and (B) reh embryos at 28 hpf. (E,F) The number of apoptotic cells observed per high-power field for each condition. Mean+s.e.m. Student’s t-test, *P<0.1 (n=15 reh and wild-type zebrafish). PHENOTYPE:
|
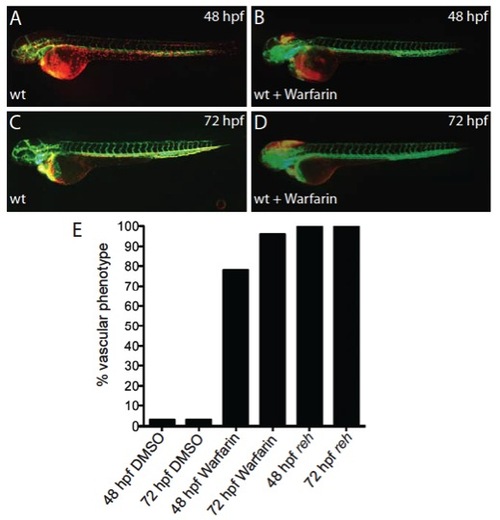
Warfarin treatment of zebrafish at 24 hpf results in cranial hemorrhaging. (A-D) Micrographs of (A,C) DMSOand (B,D) warfarin-treated Tg(gata1:dsRed);Tg(kdrl:GFP) zebrafish shows that warfarin exposure at 24 hpf can cause cranial hemorrhages by 48 and 72 hpf. (E) 78% of warfarin-treated zebrafish at 24 hpf displayed cranial hemorrhaged by 48 hpf, which increased to 96% by 72 hpf. All reh mutants but no DMSO-treated zebrafish exhibited cranial hemorrhage at 48 and 72 hpf. |
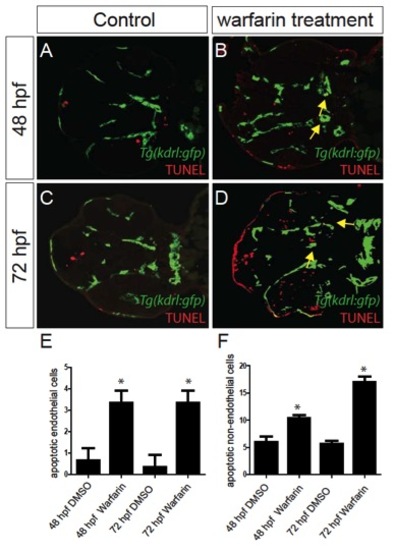
Warfarin treatment of zebrafish at 24 hpf results in cranial endothelial cell apoptosis. (A-D) Confocal sections of 48 and 72 hpf Tg(kdrl:gfp) DMSO (control)- and warfarin-treated zebrafish that were TUNEL stained (red) reveal that (B,D) warfarin-treated endothelial cells exhibit increased apoptosis (yellow arrows) when compared with (A,C) control endothelial cells. (E,F) The number of apoptotic cells observed per high-power field for each condition. Mean+s.e.m. Student’s t-test, *P<0.05 (n=15 reh and wild-type zebrafish). |