
Image
|
Figure Caption
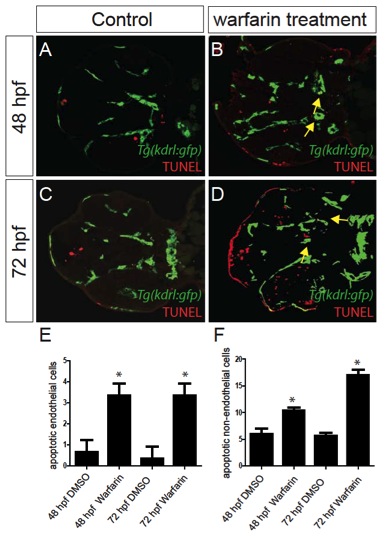
Fig. S8 Warfarin treatment of zebrafish at 24 hpf results in cranial endothelial cell apoptosis. (A-D) Confocal sections of 48 and 72 hpf Tg(kdrl:gfp) DMSO (control)- and warfarin-treated zebrafish that were TUNEL stained (red) reveal that (B,D) warfarin-treated endothelial cells exhibit increased apoptosis (yellow arrows) when compared with (A,C) control endothelial cells. (E,F) The number of apoptotic cells observed per high-power field for each condition. Mean+s.e.m. Student’s t-test, *P<0.05 (n=15 reh and wild-type zebrafish).
Acknowledgments
This image is the copyrighted work of the attributed author or publisher, and
ZFIN has permission only to display this image to its users.
Additional permissions should be obtained from the applicable author or publisher of the image.
Full text @ Development