
- Title
-
In vivo cell and tissue dynamics underlying zebrafish fin fold regeneration
- Authors
- Mateus, R., Pereira, T., Sousa, S., de Lima, J.E., Pascoal, S., Saúde, L., and Jacinto, A.
- Source
- Full text @ PLoS One
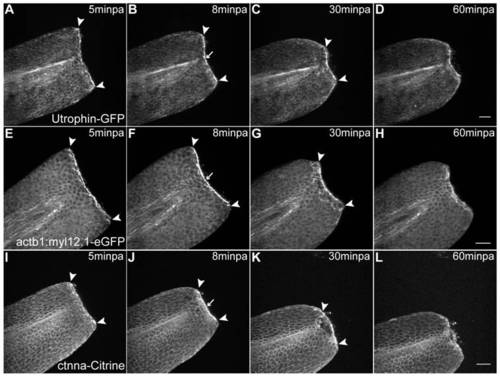
Abrupt tissue contraction and actomyosin cable formation initiate wound healing. A–D Sequential images of a representative in vivo 55 min time-lapse movie of an Utrophin-GFP mRNA-injected 2 dpf larva at different time-points after amputation. A At 5minpa, there is accumulation of actin at the leading edge cells. B By 8 minpa the actin cable is assembled (arrow) and there is tissue contraction - note displacement of arrowheads in comparison with A. C At 30 minpa, the tissue has fully contracted. D At 60 minpa, the wound inflicted by the amputation is closed. E–H Sequential images of a representative in vivo 55 min time-lapse movie of a 2 dpf actb1:myl12.1-eGFP transgenic larva. E At 5minpa, there is accumulation of myosin at the leading edge cells. F By 8 minpa the myosin cable is assembled (arrow) and there is tissue contraction - note displacement of arrowheads in comparison with E. G At 30 minpa, the tissue has fully contracted. H At 60 minpa, the wound inflicted by the amputation is closed. I–L Sequential images of a representative in vivo 55 min time-lapse movie of a 2 dpf ctnna-Citrine transgenic larva at different time-points after amputation. I At 5minpa, there is accumulation of alpha-catenin at the leading edge cells. J By 8 minpa this accumulation appears to localize to the actomyosin cable (arrow) and there is tissue contraction - note displacement of arrowheads in comparison with I. K At 30 minpa, the tissue has fully contracted and alpha-catenin is still localized at the wound edge. L At 60 minpa, the wound inflicted by the amputation is closed. Anterior is on the left and scale bars correspond to 50 μm in all images; n = 5 larvae per condition. |
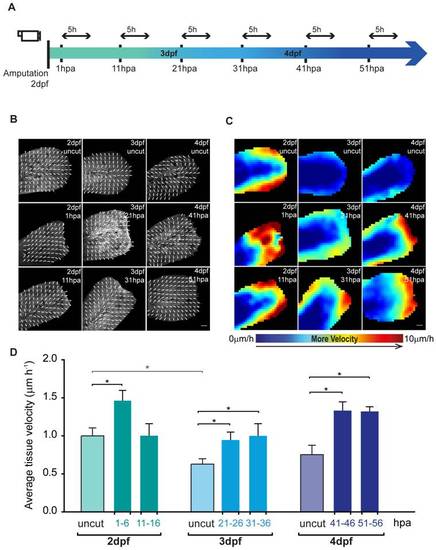
Epidermal tissue growth is enhanced upon fin fold amputation. A Experimental outline of the live imaging procedures taking into account not only the post amputation hours (hpa) but also the developmental days of the larvae (dpf). All the amputations were performed in 2 dpf larvae, and these were allowed to regenerate until the desired hour, the time point at which they were imaged for 5 hours. Taking into account that the regeneration procedure takes several days, age-matched uncut controls were imaged in the same conditions and for the same amount of time for accurate comparison. B Representative maps of vector velocity fields (VVFs) depicting the tissue movement direction along 5 h sequential time-lapse imaging of the fin fold regenerative process and respective age-matched uncut controls of β-actin:mGFP transgenics. C Representative heat maps of the VVFs shown in B depicting the tissue velocity in the fin fold area along the same 5 h sequential blocks of the fin fold regenerative process and respective age-matched uncut controls. Red end of the spectrum correlates with higher velocity (0 to 10 μm.hour1) within a given experiment. D Average velocity (μm.hour1) of VVFs of 5 larvae per condition represented in B–C. Color code matches the Experimental Outline in A. *P value<0.05; Mann-Whitney test values: 2 dpf uncut<>3 dpf uncut = 0.03; 2 dpf uncut<>1–6 hpa = 0.03; 3 dpf uncut<>21–26 hpa = 0.03; 3 dpf uncut<>31–36 hpa = 0.03; 4 dpf uncut<>41–46 hpa = 0.03; 4 dpf uncut<>51–56 hpa = 0.02; 5 larvae per condition. Anterior is on the left and scale bars correspond to 50 μm. |
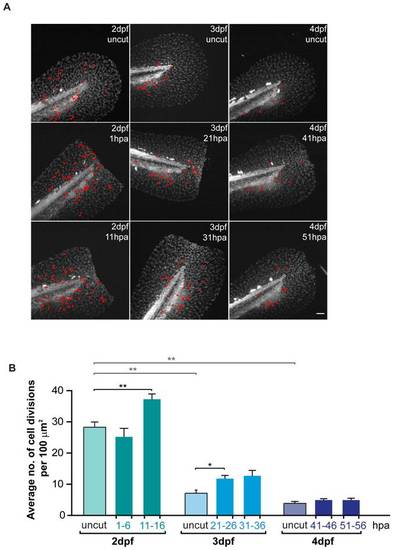
Global levels of proliferation significantly increase during regeneration in a non-spatially restricted manner. A Representative projections of H2a.f/z-GFP transgenics showing total cell divisions (marked in red) which occurred during 5 hour sequential time-lapse imaging movies of the fin fold regenerative process and respective age-matched uncut controls. B Average number of cell divisions occurring per 100 μm2 in the several conditions represented in A. Color code matches the Experimental Outline in Fig. 3A. **P value<0.01, *P value<0.05; Mann-Whitney test values: 2 dpf uncut<>3 dpf uncut = 0.008; 2 dpf uncut<>4 dpf uncut = 0.008; 2 dpf uncut<>11–16 hpa = 0.008; 3 dpf uncut<>21–26 hpa = 0.02; 3 dpf uncut<>31–36 hpa = 0.06; 5 larvae per condition. Anterior is on the left and scale bars correspond to 50 μm. |

Mesenchymal cells in the fin fold change shape and migrate distally upon injury. A–C Sequential images of a representative in vivo 6 h time-lapse movie of a 2 dpf uncut EF1α:mKO2-zCdt1;osteopontin:eGFP transgenic larva. D–F Sequential images of a representative in vivo 6 h time-lapse movie of a 2 dpf 30 minpa EF1α:mKO2-zCdt1;osteopontin:eGFP transgenic larva. G–J Sequential images of a representative in vivo 1h30 time-lapse movie of a 2 dpf 5 minpa EF1α:mKO2-zCdt1;osteopontin:eGFP transgenic larva. Zoom panels highlight osteopontin positive mesenchymal cells in the central area of the fin fold in the respective time point. White dots mark the same cells along time to allow for better visualization and tracking of cell migration. Dashed lines indicate the outline of the notochord and the edge of the amputated fin fold. Scale bars correspond to 50 μm in all images; 3–5 larvae per condition. |
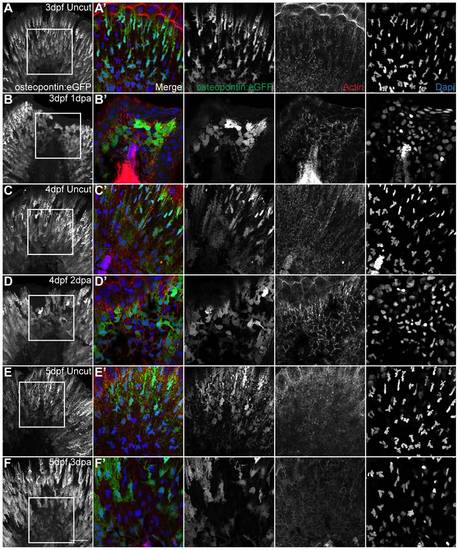
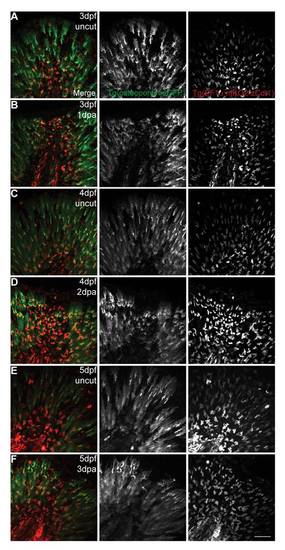
The shape modification of mesenchymal cells lasts throughout and is specific of regeneration. A,C,E Representative immunostaining with anti-GFP antibody in uncut transgenic osteopontin:eGFP larvae of 3 dpf, 4 dpf and 5 dpf respectively. B,D,F Representative immunostaining with anti-GFP antibody in amputated transgenic osteopontin:eGFP larvae of 3 dpf 1 dpa, 4 dpf 2 dpa and 5 dpf 3 dpa respectively. A–F Representative z-stack projections of the osteopontin:eGFP labeling. A′–F′ Representative single frames of the corresponding zoomed area represented by a square in A–F. Merged and single color images of osteopontin:eGFP labeling the mesenchymal cells (anti-GFP, green), actin (phalloidin, red) and nuclei (DAPI, blue), respectively. 5 Larvae per condition. Scale bar corresponds to 50 μm in all images. |

The fin fold regeneration dynamics are independent of the size of amputation. Representative brightfield live images of AB (A–L) and TU (M–X) larvae during several stages of the regenerative process and their respective age-matched uncut controls. Larvae were subjected to different amputation planes (Regular, Half-size and Diagonal cuts) and followed throughout the next 3 regenerating days, time point in which the regenerative ability was accessed. 5 Larvae per condition. |
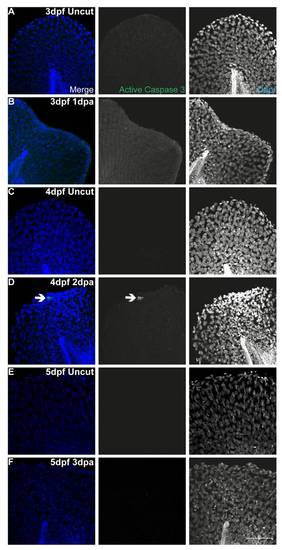
Apoptosis is not present during fin fold regeneration. Representative immunofluorescence with anti-active Caspase3 antibody in uncut and amputated larvae of 3 dpf (A–B), 4 dpf (C–D) and 5 dpf (E–F). Arrow indicates the presence of an apoptotic cell. n = 5 larvae per condition. Scale bar corresponds to 50 μm in all images. |
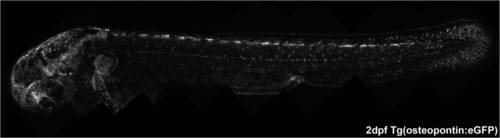
Expression pattern of the 2 dpf transgenic osteopontin:eGFP. At this stage of development, this transgenic has labeled the fin fold mesenchymal cells, but also other mesenchymal cells that are spread out along the midline and somites. Besides these, the pectoral fin, the eye and the brain are also GFP positive. |
The mesenchymal cells are maintained in G0-G1 phases of the cell cycle regardless of an amputation. Live imaging representative images of double transgenic EF1α:mKO2-zCdt1;osteopontin:eGFP larvae during several stages of the regenerative process and their respective controls. A,C,E are uncut (3 dpf, 4 dpf and 5 dpf respectively) and age matched controls for B,D,F (3 dpf 1 dpa, 4 dpf 2 dpa, 5 dpf 3 dpa respectively). Merged and single color images corresponding to osteopontin:eGFP labeling the cytoplasm of the mesenchymal cells (green) and mKO2-zCdt1 labeling the nuclei of fin fold cells in G0–G1 phases of the cell cycle (red). 3 larvae per condition. Scale bar corresponds to 50 μm. |

The mesenchymal cells are polarized. A Representative immunostaining with anti-GFP and anti-γTubulin antibodies in 2 dpf uncut transgenic osteopontin:eGFP larvae (single frame). B–C Representative immunostaining with anti-GFP anti-γTubulin antibodies in amputated transgenic osteopontin:eGFP larvae of 2 dpf 1 hpa and 3 dpf 1 dpa (single frames). A′–C′ Representative single frames of the corresponding zoomed area represented by a square in A–C. Merged and single color images of the MTOC (γTubulin, red) together with the nuclei (DAPI, blue) and osteopontin:eGFP labeling the mesenchymal cells (anti-GFP, green), respectively. The arrows highlight the presence of a MTOC to allow better comparison of its position relative to the corresponding nucleus. 5 Larvae per condition. Scale bar corresponds to 50 μm in all images. |