
- Title
-
Neuromuscular effects of G93A-SOD1 expression in zebrafish
- Authors
- Sakowski, S.A., Lunn, J.S., Busta, A.S., Oh, S.S., Zamora-Berridi, G., Palmer, M., Rosenberg, A.A., Philip, S.G., Dowling, J.J., and Feldman, E.L.
- Source
- Full text @ Mol. Neurodegener.
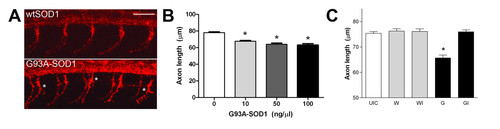
Effects of G93A-SOD1on developing zebrafish MN axons. Zebrafish embryos at the 1-4 cell stage were microinjected with wtSOD1, G93A-SOD1 and/or igf-I RNA after timed mating of adult AB strain zebrafish and underwent IHC with the SV2 antibody at 30 hpf to visualize MN axons. (A) SV2 IHC demonstrates increased branching of motor axons, represented by (*) in embryos injected with G93A-SOD1 (50 ng/μl) RNA, compared to embryos injected with wtSOD1 (50 ng/μl) RNA. 20x magnification confocal images; scale bar equals 50 μm. (B) Measurement of axon length in embryos injected with 0-100 ng/μl G93A-SOD1 RNA reveals a dose-dependent decrease in MN axon length; * P < 0.001 compared to UIC. (C) Co-injection of igf-I RNA (I; 200 ng/μl) attenuates the effects of G93A-SOD1 (G; 50 ng/µl) on axon length. No significant effects of wtSOD1 (W; 50 ng/μl) are observed, regardless of IGF-I expression. * P < 0.001 compared to UIC. |
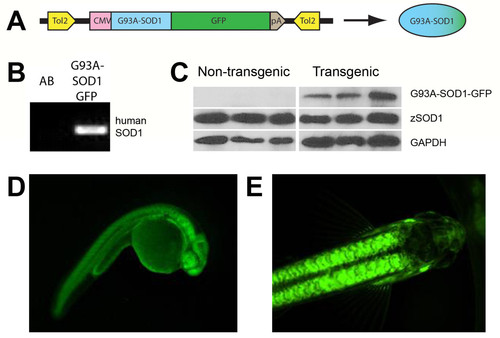
Transgenic ALS zebrafish. Transgenic ALS zebrafish are generated by Tol2-mediated transgenesis. (A) Constructs include a 5′ CMV promoter, human G93A-SOD1 and a 3′ EGFP C-terminal fusion protein including a SV40 late poly A tail. Microinjection of construct cDNA in the presence of Tol2 transposase RNA facilitates efficient, random integration of the transgene via flanking Tol2 sites. (B) PCR of genomic DNA extracted from 24 hpf F1 generation embryos demonstrates germline transmission of the G93A-SOD1-GFP transgene, confirming successful generation of the transgenic lines. (C) Western immunoblotting of protein lysates from 24 hpf F1 generation embryos demonstrates expression levels of the G93A-SOD1-GFP protein in three independent clutches of transgenic embryos. (D-E) Images of an F1 embryo (D; 24 hpf) and adult (E; 3 months of age) from the G21 G93A-SOD1-GFP transgenic line demonstrate stable ubiquitous expression of the fusion protein throughout the zebrafish lifespan. |
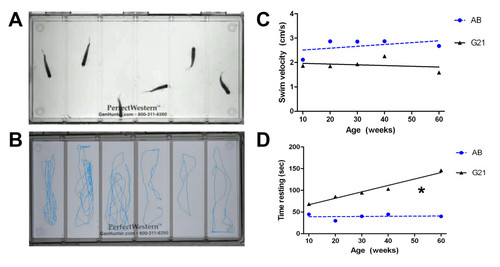
Activity monitoring in transgenic ALS zebrafish. (A): Representative experimental layout for monitoring spontaneous swimming behavior of 20 week old control (wells 1-3) and transgenic G93A-SOD1-GFP (wells 4-6) zebrafish using the Noldus Larvae Activity Monitoring System. (B) Movement tracks extrapolated from a 1 minute trial by EthoVision for analysis of multiple different activity parameters. (C) While minimal differences are observed in the spontaneous activity levels of transgenic and control zebrafish throughout the disease course, transgenic G93A-SOD1-GFP zebrafish exhibit a consistently lower swimming velocity relative to age-matched AB controls. (D) As the disease progresses, transgenic G93A-SOD1-GFP zebrafish spend more time resting than age-matched control AB zebrafish. * P < 0.01 compared to AB control slope. PHENOTYPE:
|
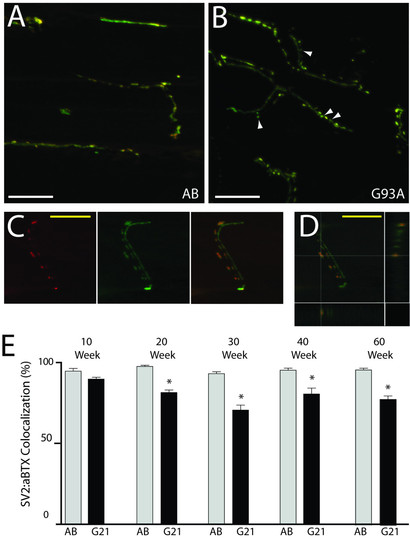
Neuromuscular junction integrity in transgenic ALS zebrafish. NMJs in transverse muscle sections from control AB and transgenic G93A-SOD1-GFP zebrafish were examined at multiple timepoints after αBTX staining (red) to label AChR clusters in the muscle fibers and SV2/NF IHC (green) to label MNs. Colocalization (yellow) is apparent at intact NMJs. (A-B) Representative control AB zebrafish (A) exhibit long axons with multiple synapses, whereas transgenic G93A-SOD1-GFP zebrafish (B) exhibit shorter axons and varied innervation patterns with some denervated NMJs (arrowheads). 60x oil magnification confocal images; scale bar = 20 μm. (C-D) A representative image of an individual neuron, with images included as both separated and merged fluorescent channels (C) and visualized with orthogonal XZ and YZ views of the z-series confocal image (D), validates that colocalization of SV2/NF and αBTX is representative of NMJs. 60x oil magnification confocal images; scale bar = 20 μm. (E) Quantification of SV2/NF:αBTX colocalization in 10-60 week old control AB and transgenic G93A-SOD1-GFP zebrafish. * P < 0.0001 compared to age-matched AB controls. PHENOTYPE:
|
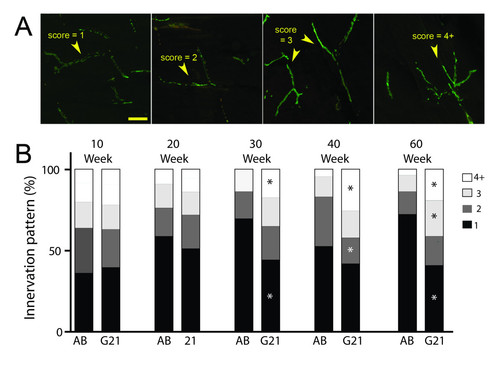
Neuromuscular innervation characterization in transgenic ALS zebrafish. Analysis of innervation patterns in 10-60 week old control AB and transgenic G93A-SOD1-GFP zebrafish. (A) Axons are scored as long (score = 1), moderately branched (scores = 2 or 3) or complex (score = 4+), as demonstrated in representative images. (B) Quantification of scoring results in 10-60 week old control AB and transgenic G93A-SOD1-GFP zebrafish. * P < 0.01 compared to age-matched AB controls. PHENOTYPE:
|
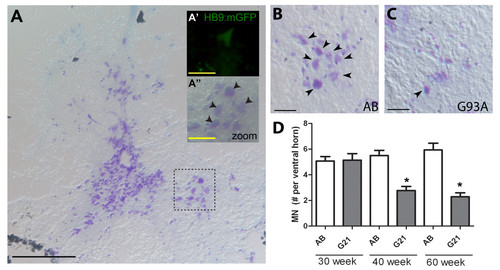
MN loss in transgenic ALS zebrafish. Spinal cord cross sections from 30-60 week old zebrafish were stained with Cresyl violet Nissl (purple) to label MNs. (A) Representative low power images from control AB zebrafish is provided for orientation purposes; scale bar = 200 μm. Inset zoomed images of the spinal cord ventral horn from AB (A′′) and transgenic HB9:mGFP (A′) zebrafish validate our approach to quantify MN number based on cell body size and localization to the ventral horn; scale bar = 25 μm. (B-C) Representative images from control AB (B) and transgenic G93A-SOD1-GFP (C) zebrafish at 60 weeks of age. Arrowheads denote motor neurons; 20X magnification images; scale bar = 100 μm. (D) Quantification of MN counts per ventral horn in 30, 40 and 60 week old control AB and transgenic G93A-SOD1-GFP zebrafish. * P < 0.0001 compared to age-matched AB controls. |