
FIGURE
Fig. 5
- ID
- ZDB-FIG-130115-28
- Publication
- Sakowski et al., 2012 - Neuromuscular effects of G93A-SOD1 expression in zebrafish
- Other Figures
- All Figure Page
- Back to All Figure Page
Fig. 5
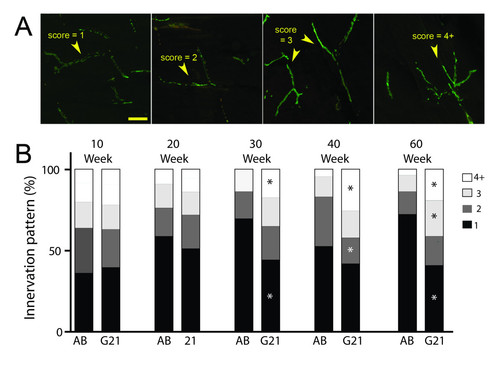
Neuromuscular innervation characterization in transgenic ALS zebrafish. Analysis of innervation patterns in 10-60 week old control AB and transgenic G93A-SOD1-GFP zebrafish. (A) Axons are scored as long (score = 1), moderately branched (scores = 2 or 3) or complex (score = 4+), as demonstrated in representative images. (B) Quantification of scoring results in 10-60 week old control AB and transgenic G93A-SOD1-GFP zebrafish. * P < 0.01 compared to age-matched AB controls. |
Expression Data
Expression Detail
Antibody Labeling
Phenotype Data
| Fish: | |
|---|---|
| Observed In: | |
| Stage: | Adult |
Phenotype Detail
Acknowledgments
This image is the copyrighted work of the attributed author or publisher, and
ZFIN has permission only to display this image to its users.
Additional permissions should be obtained from the applicable author or publisher of the image.
Full text @ Mol. Neurodegener.