
|
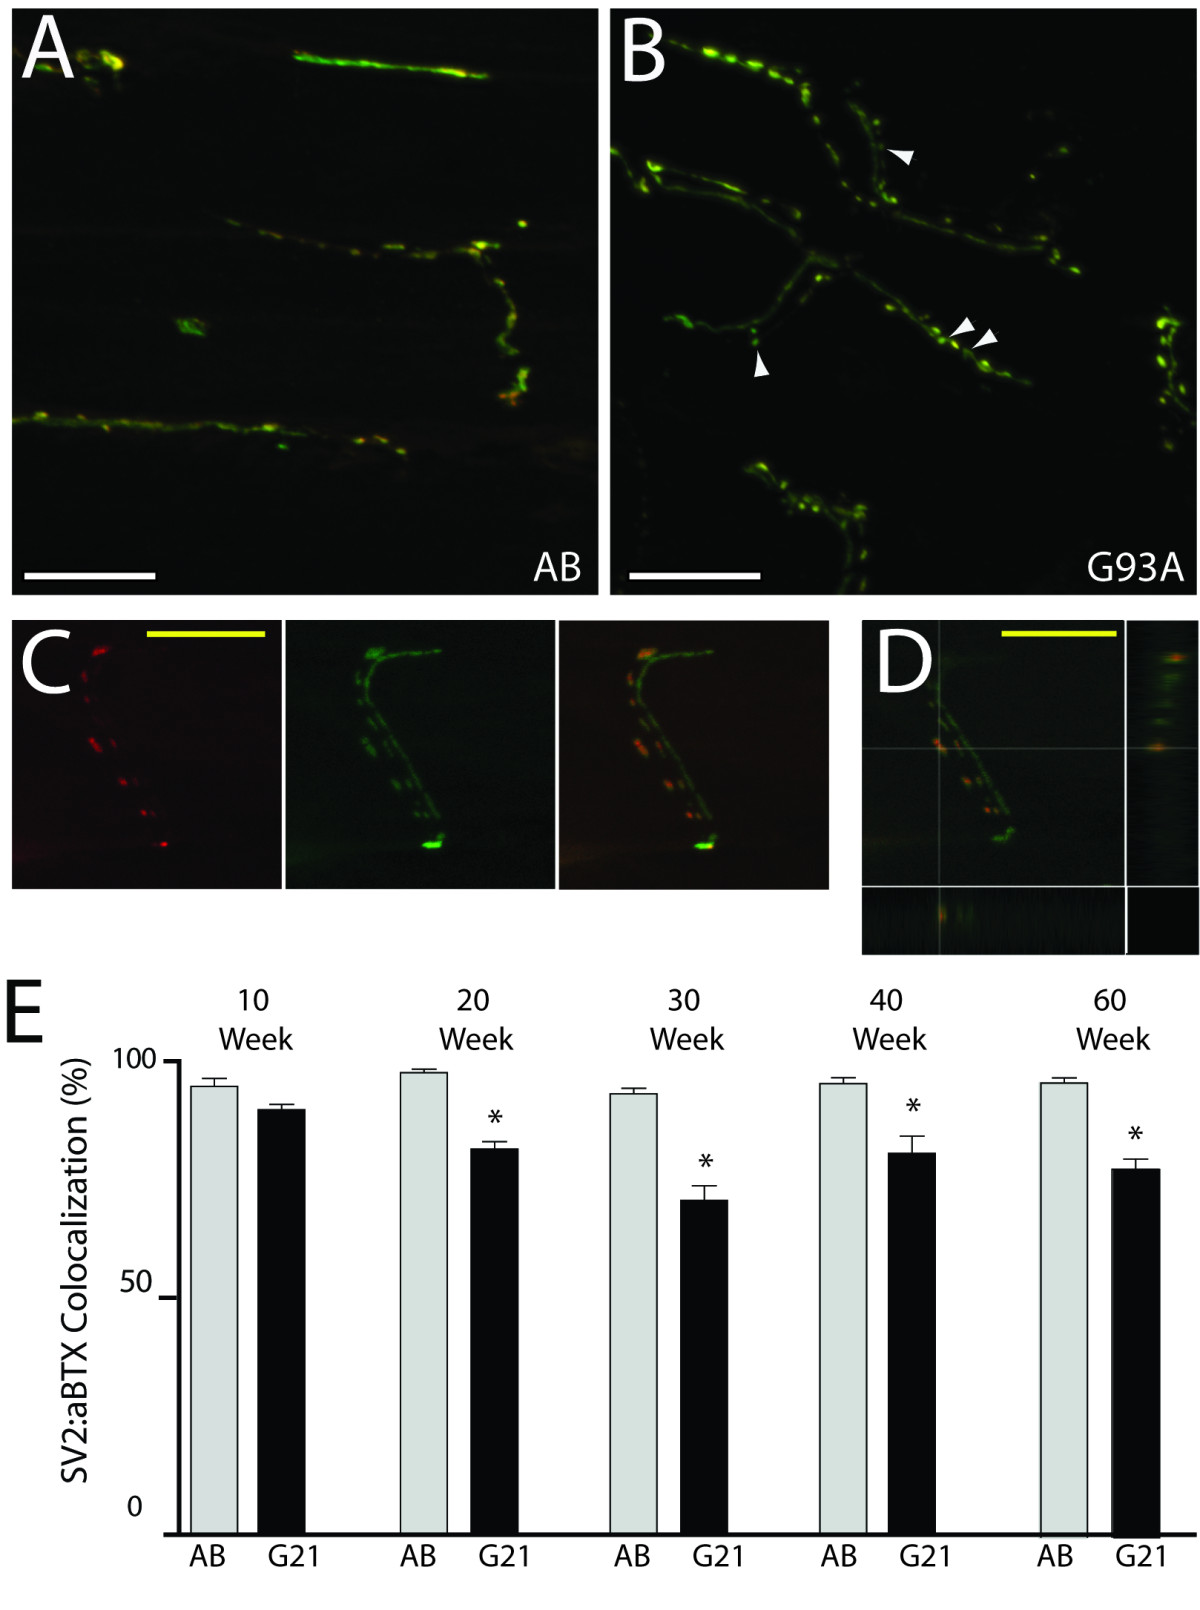
Fig. 4 Neuromuscular junction integrity in transgenic ALS zebrafish. NMJs in transverse muscle sections from control AB and transgenic G93A-SOD1-GFP zebrafish were examined at multiple timepoints after αBTX staining (red) to label AChR clusters in the muscle fibers and SV2/NF IHC (green) to label MNs. Colocalization (yellow) is apparent at intact NMJs. (A-B) Representative control AB zebrafish (A) exhibit long axons with multiple synapses, whereas transgenic G93A-SOD1-GFP zebrafish (B) exhibit shorter axons and varied innervation patterns with some denervated NMJs (arrowheads). 60x oil magnification confocal images; scale bar = 20 μm. (C-D) A representative image of an individual neuron, with images included as both separated and merged fluorescent channels (C) and visualized with orthogonal XZ and YZ views of the z-series confocal image (D), validates that colocalization of SV2/NF and αBTX is representative of NMJs. 60x oil magnification confocal images; scale bar = 20 μm. (E) Quantification of SV2/NF:αBTX colocalization in 10-60 week old control AB and transgenic G93A-SOD1-GFP zebrafish. * P < 0.0001 compared to age-matched AB controls.