
|
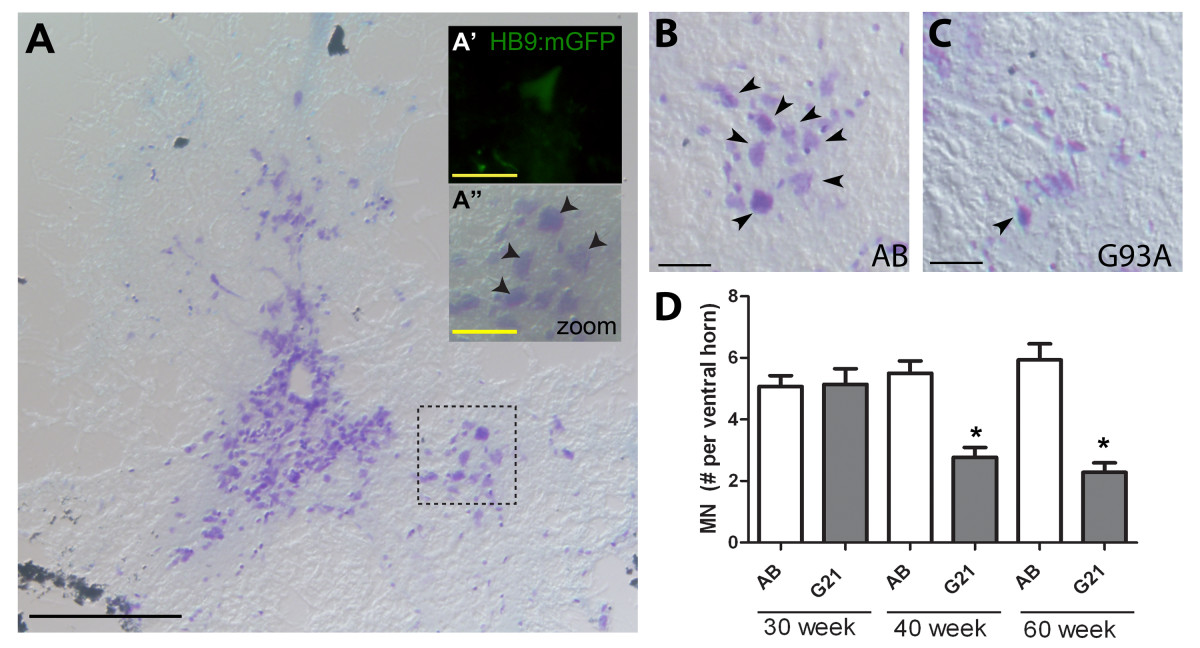
Fig. 6 MN loss in transgenic ALS zebrafish. Spinal cord cross sections from 30-60 week old zebrafish were stained with Cresyl violet Nissl (purple) to label MNs. (A) Representative low power images from control AB zebrafish is provided for orientation purposes; scale bar = 200 μm. Inset zoomed images of the spinal cord ventral horn from AB (A′′) and transgenic HB9:mGFP (A′) zebrafish validate our approach to quantify MN number based on cell body size and localization to the ventral horn; scale bar = 25 μm. (B-C) Representative images from control AB (B) and transgenic G93A-SOD1-GFP (C) zebrafish at 60 weeks of age. Arrowheads denote motor neurons; 20X magnification images; scale bar = 100 μm. (D) Quantification of MN counts per ventral horn in 30, 40 and 60 week old control AB and transgenic G93A-SOD1-GFP zebrafish. * P < 0.0001 compared to age-matched AB controls.