FIGURE SUMMARY
Title

RBP4 Disrupts Vitamin A Uptake Homeostasis in a STRA6-Deficient Animal Model for Matthew-Wood Syndrome

Authors
Isken, A., Golczak, M., Oberhauser, V., Hunzelmann, S., Driever, W., Imanishi, Y., Palczewski, K., and von Lintig, J.
Source
Full text @ Cell Metab.

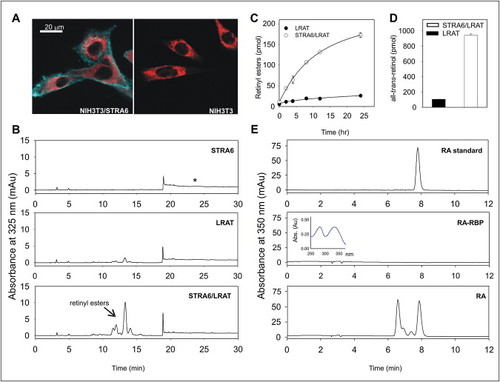
STRA6-Dependent Uptake and Release of Retinoids
(A) Subcellular localization of STRA6 tagged with 1D4 epitope (blue) stably expressed in NIH 3T3 cells was determined by immunohistochemistry and confocal microscopy; calreticulin was detected by anti-calreticulin polyclonal antibody (red). Scale bar = 20 μm.
(B) Chromatograms representing retinoid composition of STRA6-, LRAT-, and STRA6/LRAT-expressing cells after incubation with 8 μM holo-RBP4. Asterisk indicates the position at which all-trans-retinol migrates.
(C) Time course of retinol uptake. LRAT- and STRA6/LRAT-expressing cells were incubated with 8 μM holo-RBP4. Retinoid content of the cells was determined at the time points indicated. Values represent the mean ± SD of three independent experiments.
(D) STRA6-dependent release of retinol. Cells were incubated with 10 μM all-trans-retinol for 16 hr prior to this experiment. Cells then were washed with PBS, and fresh medium containing 8 μM apo-RBP4 was added. After 16 hr, the medium was collected and retinoid composition was determined by HPLC. Values represent the mean ± SD of three independent experiments.
(E) Retinoic acid uptake is not STRA6 dependent. Apo-RBP was loaded with all-trans-retinoic acid (RA) and purified by fast protein liquid chromatography (FPLC). Efficiency of RA loading was confirmed by absorption spectroscopy (inset). NIH 3T3 cells stably expressing STRA6 and LRAT were incubated with 8 μM RA-RBP4 or 8 μM RA overnight. Retinoid composition was determined by reverse-phase chromatography.

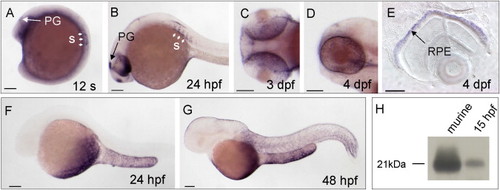
stra6 and rbp4 mRNA Expression during Zebrafish Development Analyzed by Whole-Mount In Situ Hybridization
(A) At the 12-somite stage, stra6 mRNA (blue) is expressed in the yolk syncytium and in mesendodermal cells in the head and trunk region. Staining is also detectable in the eye anlage, the pineal gland (PG), and anterior somites (arrowheads).
(B) At 24 hours postfertilization (hpf), staining for stra6 (blue) is seen in the developing eyes, the anterior midbrain, the pineal gland (PG), and anterior somites (arrowheads).
(C and D) At the 3 and 4 days postfertilization (dpf) larval stages, stra6 mRNA is expressed in the eyes and the pineal gland.
(E) Cross-section through an eye of a 4 dpf larva shows stra6 expression (blue) in the retinal pigment epithelium (RPE).
(F and G) rbp4 mRNA expression (blue) in a 24 hpf (F) and 48 hpf (G) embryo. Staining patterns reveal that rbp4 is expressed in the yolk syncytial layer. (H) Immunoblot analysis for Rbp4 expression in 15 hpf embryos. Murine plasma (0.1 μl) was used as a control.
Scale bars = 100 μm. Anterior is to the left in all pictures.

Targeted Gene Knockdown of Stra6 Causes Embryonic Abnormalities and Vitamin A Deficiency in Developing Eyes
(A) Schematic structure of the zebrafish stra6 gene. White boxes indicate the 5′- and 3′-primed untranslated regions (UTRs), and black boxes represent the coding regions of the stra6 mRNA.
(B) Morpholino oligonucleotide (MO) binding sites directed against the stra6 mRNA. Binding of MO1 and MO2 blocks translation of the stra6 mRNA. For the deletion of exon 5, MO3 is targeted to the exon 5 splice donor site of the stra6 pre-mRNA.
(C) RT-PCR analysis with exon 5-spanning primers MO3-up and MO3-down (see [B]) confirms the deletion of exon 5 in MO3-treated morphants. Lane 1, MO3-treated embryo with developmental defects (see [D]); lane 2, control embryo; lane 3, MO3-treated embryo without severe developmental defects; lane 4, control embryo.
(D) Photographs of 3 dpf control and characteristic stra6 morphant larvae injected with MO1, MO2, and MO3, respectively.
(E) Retinyl esters (RE) and 11-cis-retinal levels in the heads of 4 dpf MO1 and MO2 morphants as compared to control larvae. Values represent the mean ± SD of three independent experiments. *p < 0.005 versus control by Student′s t test.

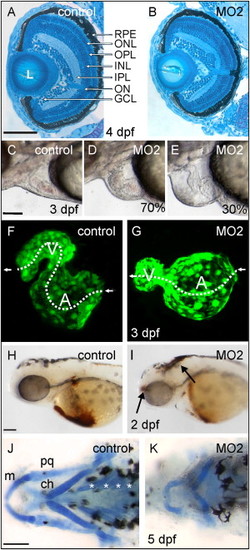
Stra6 Deficiency Causes Multisystemic Malformations in Zebrafish
(A and B) Cross-sections through the eye of 4 dpf control (A) and MO2 morphant (B) larvae. The stra6 morphant eye is smaller but shows regular stratification of distinct retinal layers. L, lens; RPE, retinal pigment epithelium; ONL, outer nuclear layer; OPL, outer plexiform layer; INL, inner nuclear layer; IPL, inner plexiform layer; ON, optic nerve; GCL, ganglion cell layer.
(C–E) Close-up views of the pericardial region of control (C) and MO2-treated morphants (D and E). Characteristics of the heart shown in (D) represent 70% of the morphants; characteristics of the heart shown in (E) represent 30% of the morphants (n = 100). Note the absence of red blood cells in the heart due to a disrupted circulation in (E).
(F and G) Three-dimensional view of the heart of 3 dpf control (F) and MO2-treated (G) TG(fli1:EGFP)Y1 embryos. Blood flow is indicated by dashed lines. The ventricle (V) is on the left, and the atrium (A) is on the right.
(H and I) Control (H) and 2 dpf MO2-treated (I) embryos with the heart phenotype shown in (E) stained for hemoglobin. In controls, staining for erythrocytes was primarily detectable in the heart and afferent vessels over the yolk. In morphants, hemoglobin was greatly reduced in the heart and afferent vessels, but red blood cell extravasations were visible in the head (see arrows).
(J and K) Alcian blue staining of cartilage of the craniofacial skeleton of 5 dpf control (J) and MO2-treated morphant (K) larvae. The Meckel′s cartilage (m), palatoquadrates (pq), and ceratohyales (ch) were deformed and staining of ceratobranchials (asterisks) was highly reduced in Stra6 deficiency.
Animals were raised in PTU-free water. Anterior is to the left in all pictures. Scale bars = 100 μm in (A)–(E) and (H)–(K).

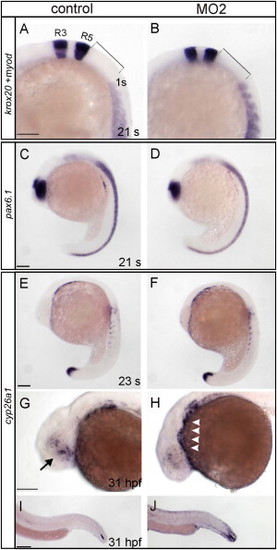
Comparison of Marker Gene Expression between Control and stra6 Morphant Embryos.
Marker genes and developmental stages of the embryos shown are indicated. Control embryo is shown at the left; stra6 morphant embryo is shown at the right. Animals were raised in PTU-free water.
(A and B) Double staining for krox20 and myoD reveals normal patterning of the hindbrain rhombomeres and somites. Additionally, the distance between rhombomere 5 (R5) and the first somite (1 s) is comparable between control and morphant embryos.
(C and D) Staining for pax6.1 (blue) at the 21-somite stage shows that the presumptive retina is smaller in stra6 morphants than in controls but that patterns of pax6.1 mRNA expression are comparable along the anteroposterior axis.
(E–J) Staining for cyp26a1 mRNA expression.
(E and F) cyp26a1 mRNA expression was indistinguishable between controls and MO2 morphants at the 23-somite stage.
(G–J) cyp26a1 mRNA expression was reduced in the developing eye of MO2-treated morphants as compared to controls (arrow in [G]), but deeper staining appeared in the pericardial region (arrowheads in [H]) and in caudal parts of the morphant embryo (J) as compared to the control (I).
Scale bars = 100 μm. Anterior is to the left in all pictures.

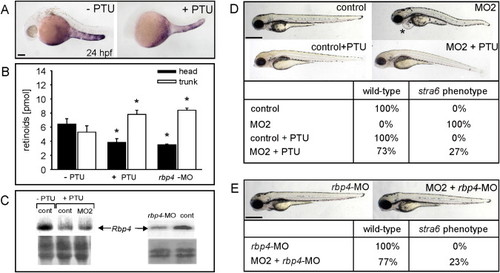
PTU and rbp4-MO Treatments Prevent Developmental Abnormalities in stra6 Morphants
(A) rbp4 mRNA expression (blue) was reduced in PTU-treated embryos.
(B) Retinoids (retinaldehyde and RE) of the head and trunk of 4 dpf control and PTU- and rbp4-MO-treated larvae. Values represent the means ± SD of three independent experiments. *p < 0.02 versus control by Student′s t test.
(C) Immunoblot analysis of Rbp4 levels in 24 hpf embryos treated with PTU, PTU and MO2 (left), and rbp4-MO (right) as compared to respective controls. Ponceau S red-stained membranes are shown as a loading control (lower panel).
(D) stra6 morphants and controls were raised in the presence and absence of PTU (n = 170 each). Representative photographs of 3 dpf larvae are shown. PTU treatment prevented developmental abnormalities in 73% of the stra6 morphants. In the absence of PTU, all stra6 morphants displayed cardiac edema (asterisk).
(E) Larvae raised from oocytes either injected with rbp4-MO or coinjected with rbp4-MO and MO2. These morphant larvae were raised in the absence of PTU. rbp4 morphant larvae showed no developmental abnormalities (n = 120). Coinjection of rbp4-MO and MO2 largely prevented developmental abnormalities in 77% of the compound morphants (n = 120).
Scale bar = 100 μM in (A) and 500 μm in (D) and (E). Anterior is to the left in all pictures.

Acknowledgments
This image is the copyrighted work of the attributed author or publisher, and ZFIN has permission only to display this image to its users. Additional permissions should be obtained from the applicable author or publisher of the image.

Reprinted from Cell Metabolism, 7(3), Isken, A., Golczak, M., Oberhauser, V., Hunzelmann, S., Driever, W., Imanishi, Y., Palczewski, K., and von Lintig, J., RBP4 Disrupts Vitamin A Uptake Homeostasis in a STRA6-Deficient Animal Model for Matthew-Wood Syndrome, 258-268, Copyright (2008) with permission from Elsevier. Full text @ Cell Metab.