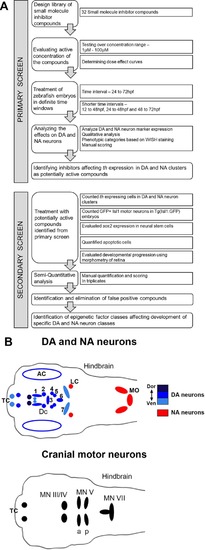
Design of Small Molecule Screen in two phases. (A) Schematic depiction of primary screening and secondary screening procedure. We selected 32 small molecule inhibitors that target chromatin regulators. Zebrafish larvae were exposed to the small molecule inhibitors during distinct phases of DA and NA neuron development ranging from 24 to 72 hpf. We screened all compounds at different concentration to find the optimal dosage for each small molecule inhibitor. During the primary screen we evaluated the effects of all selected small molecule inhibitors on DA and NA neurons by whole mount in situ hybridization (WISH) analysis of tyrosine hydroxylase expression. Small molecules that caused a dose-dependent change in DA and NA marker expression were considered a screening hit. For these compounds, we performed a secondary screen to evaluate DA and NA neurogenesis steps affected. (B) Schematic drawings of the distribution of DA and NA neurons (top, taken from Mahler et al., 2010), as well as of Isl1 expressing cranial motor neurons in the larval zebrafish brain at 96 hpf. DA neurons (blue, color intensity encodes dorsal to ventral position of DA groups as indicated) analyzed during the screening procedure reside in the olfactory bulb, subpallium (telencephalon, Tc), retina, pretectum (PrT) and ventral diencephalon (DC1–6) (Holzschuh et al., 2001; Rink and Wullimann, 2002). NA neurons (red) reside within the locus coeruleus (LC) and medulla oblongata (MO) area of the hindbrain. The analyzed Isl1 expressing cranial motor neurons reside within the telencephalon (Tc), the midbrain (MN II/IV) and the hindbrain (MN Va, Vp and MN VII) (Higashijima et al., 2000). AC, amacrine cells; DA, dopaminergic; DC, diencephalic; LC, locus coeruleus; MN, motor neuron cluster; MO, medulla oblongata; NA, noradrenergic; Tc, telencephalon.

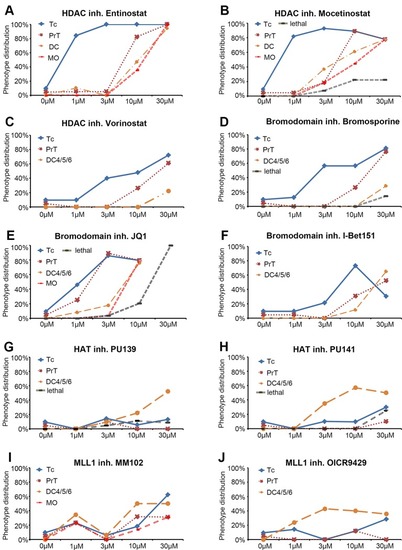
Dose response curves for selected small molecule inhibitors. (A–J) Dose response curves for HDAC inhibitors (A) Entinostat, (B) Mocetinostat, (C) Vorinostat, for Bromodomain inhibitors (D) Bromosporine, (E) JQ1, (F) I Bet151, for HAT inhibitors (G) PU139, (H) PU141, and for MLL1-WDR5 interaction inhibitors (I) MM102 and (J) OICR9429. Each line represents a specific DA or NA neuron cluster for which a change in th expression was observed. The black dashed line (“lethal”) indicates the percentage of embryos that died at a given compound concentration. Each data point represents the percentage of embryos showing an effect on the specific neuron cluster at the depicted concentration. Abbreviations for dopaminergic clusters: Tc, telencephalon; PrT, pretectum; DC, diencephalic clusters 1–6; noradrenergic clusters; MO, medulla oblongata.

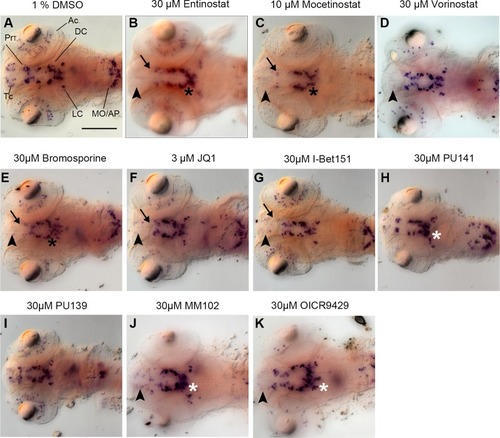
Primary Screen results for representative small molecule inhibitors. (A–K) Expression of the DA and NA neuronal marker th detected by whole mount in situ hybridization in embryos fixed after drug or control treatment at 96 hpf. Treatments are indicated above each panel. During the primary screen th expression was analyzed in DA clusters in telencephalon, pretectum, and diencephalic groups 1–6. Dorsal views of heads of larvae, images generated from Z-Projections of image stacks. Neuronal groups with reduced WISH stain are indicated as follows: Black arrowheads for telencephalic DA clusters (B–G, J, K), black arrows for pretectal DC clusters (B, C, E–G), black asterisks for DC DA clusters (B, C, E). White asterisks indicate increased stain intensities in DC DA clusters (H–K). Scale bar in (A) is 100 µm for all panels. AC, amacrine cells; Tc, telencephalon; PrT, pretectum; DC, diencephalic groups; Lc, locus coeruleus; MO/AP, medulla oblongata/area postrema.

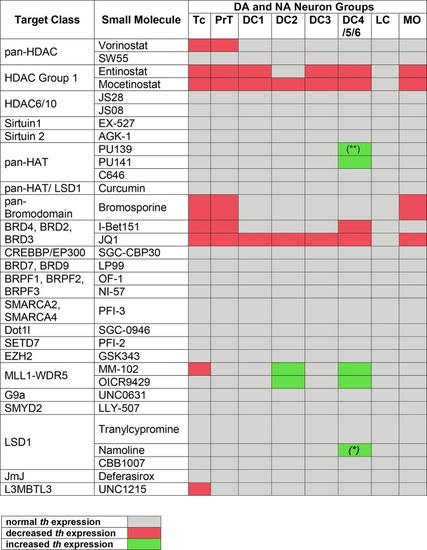
Summary of Primary Screening Results. Table depicting effects on th expression observed in zebrafish embryos after treatments with inhibitors shown at left. Only when treatment with at least one compound concentration caused one third or more of the assayed embryos to be affected, th expression was classified as decreased or increased, respectively. Treatments at 1 to 30 µM were considered, while 100 µM was excluded due to high lethality with most compounds. Color code at bottom: decreased or increased th expression represents both potentially changed expression levels or changed number of expressing cells, which could not be distinguished during qualitative analysis of images. (*) For Namoline, the increase of DC4/5/6 was only observed at 10 µM. (**) For PU139, only 7 out of 23 embryos showed a slight increase in stain intensity.

Quantification of Secondary Screen—HDAC inhibitors. (A–C) Analysis of th expression (WISH) for DA and NA neuron development. (D–F) Immunohistochemistry for Isl1-GFP positive cranial motor neurons. (G–H) WISH analysis of sox2 expression in neural stem cells. (J–L) TUNEL assay to detect apoptotic cells. Embryos were treated with the HDAC inhibitors Entinostat, Mocetinostat or Vorinostatat from 24 to 72 hpf and fixed at 96 hpf. (A, B, D, E, G, H, J, K) Dorsal views of heads of larvae, images generated from Z-Projections of image stacks, anterior at left. Scale bars represent 100 µm. Bar charts illustrate the mean cell count numbers of each neuronal subtype for (C)th expressing cells, (F)isl1:GFP transgene expressing cells, (L) apoptotic cells. Error bars depict standard deviations of the means. Asterisks indicate significant differences compared with the 1% DMSO control (p < 0.001). (I) For analysis of sox2 expression, embryos were classified into absent, decreased, normal or increased sox2 expression phenotypes (see color code) and embryo numbers were normalized to 100%. AC, amacrine cells; DA, dopaminergic; NA, noradrenergic; Tc, telencephalon; PrT, pretectum; DC, diencephalic groups; Lc, locus coeruleus; MO/AP, medulla oblongata/area postrema; MN, motor neuron cluster; VZ, ventricular zone; RPZ, retinal proliferation zone; PA, pharyngeal arches; NP, nasal placodes; DC/MB, diencephalon and midbrain region; HB, hindbrain.

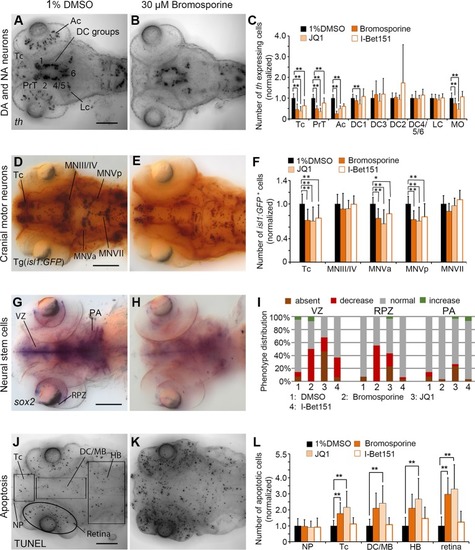
Quantification of Secondary Screen—Bromodomain inhibitors. (A–C) Analysis of th expression (WISH) for DA and NA neuron development. (D–F) Immunohistochemistry for Isl1-GFP positive cranial motor neurons. (G–I) WISH analysis of sox2 expression in neural stem cells. (J–L) TUNEL assay to detect apoptotic cells. Embryos were treated with the Bromodomain inhibitors Bromosporine, JQ1 or I-Bet151 from 24 to 72 hpf and fixed at 96 hpf. (A, B, D, E, G, H, J, K) Dorsal views of heads of larvae, images generated from Z-Projections of image stacks, anterior at left. Scale bars represent 100 µm. Bar charts illustrate the mean cell count numbers of each neuronal subtype for (C)th expressing cells, (F)isl1:GFP transgene expressing cells, (L) apoptotic cells. Error bars depict standard deviation of the mean. Asterisks indicate significant differences compared with the 1% DMSO control (p < 0.001). (I) For analysis of sox2 expression, embryos were classified into absent, decreased, normal or increased sox2 expression phenotypes (see color code), embryo numbers were normalized to 100%. AC, amacrine cells; DA, dopaminergic; NA, noradrenergic; Tc, telencephalon; PrT, pretectum; DC, diencephalic groups; Lc, locus coeruleus; MO/AP, medulla oblongata/area postrema; MN, motor neuron cluster; VZ, ventricular zone; RPZ, retinal proliferation zone; PA, pharyngeal arches; NP, nasal placodes; DC/MB, diencephalon and midbrain region; HB, hindbrain.

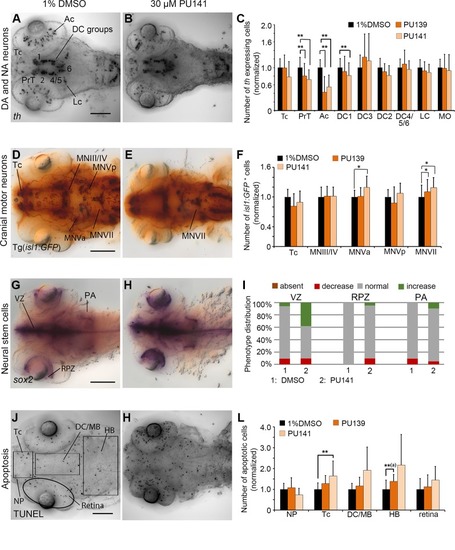
Quantification of Secondary Screen, HAT inhibitors. (A–C) Analysis of th expression (WISH) for DA and NA neuron development. (D–F) Immunohistochemistry for Isl1-GFP positive cranial motor neurons. (G–I) WISH analysis of sox2 expression in neural stem cells. (J–L) TUNEL assay to detect apoptotic cells. Embryos were treated with the HAT inhibitors PU139 or PU141 from 24 to 72 hpf and fixed at 96 hpf. (A, B, D, E, G, H, J, K) Dorsal views of heads of larvae, images generated from Z-Projections of image stacks, anterior at left. Scale bars represent 100 µm. Bar charts illustrate the mean cell count numbers of each neuronal subtype for (C) th expressing cells, (F)isl1:GFP transgene expressing cells, (L) apoptotic cells. Error bars depict standard deviations of the means. Asterisks indicate significant differences compared with the 1% DMSO control (p < 0.001). (I) For analysis of sox2 expression, embryos were classified into absent, decreased, normal or increased sox2 expression phenotypes (see color code) and embryo numbers were normalized to 100%. AC, amacrine cells; DA, dopaminergic; NA, noradrenergic; Tc, telencephalon; PrT, pretectum; DC, diencephalic groups; Lc, locus coeruleus; MO/AP, medulla oblongata/area postrema; MN, motor neuron cluster; VZ, ventricular zone; RPZ, retinal proliferation zone; PA, pharyngeal arches; NP, nasal placodes; DC/MB, diencephalon and midbrain region; HB, hindbrain.

Acknowledgments
This image is the copyrighted work of the attributed author or publisher, and ZFIN has permission only to display this image to its users. Additional permissions should be obtained from the applicable author or publisher of the image. Full text @ Front Genet