IMAGE

Figure 2

ID
ZDB-IMAGE-200406-38
Source
Figures for Westphal et al., 2020
Image
Figure Caption

Figure 2

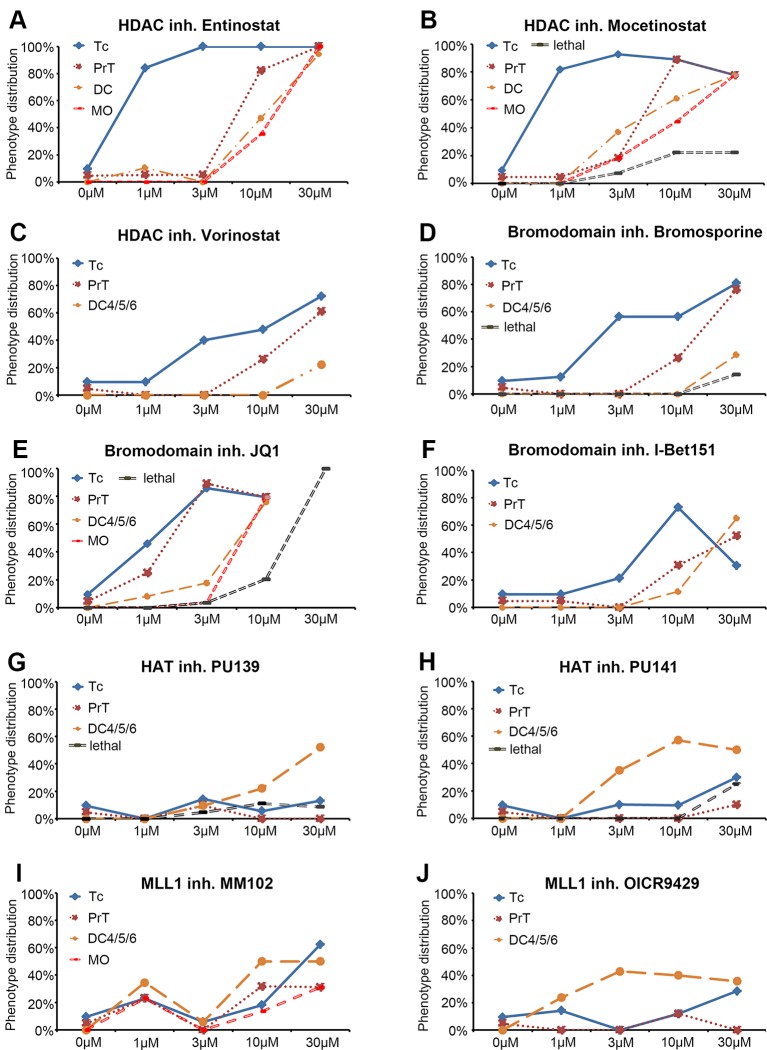
Dose response curves for selected small molecule inhibitors. (A–J) Dose response curves for HDAC inhibitors (A) Entinostat, (B) Mocetinostat, (C) Vorinostat, for Bromodomain inhibitors (D) Bromosporine, (E) JQ1, (F) I Bet151, for HAT inhibitors (G) PU139, (H) PU141, and for MLL1-WDR5 interaction inhibitors (I) MM102 and (J) OICR9429. Each line represents a specific DA or NA neuron cluster for which a change in th expression was observed. The black dashed line (“lethal”) indicates the percentage of embryos that died at a given compound concentration. Each data point represents the percentage of embryos showing an effect on the specific neuron cluster at the depicted concentration. Abbreviations for dopaminergic clusters: Tc, telencephalon; PrT, pretectum; DC, diencephalic clusters 1–6; noradrenergic clusters; MO, medulla oblongata.

Acknowledgments
This image is the copyrighted work of the attributed author or publisher, and ZFIN has permission only to display this image to its users. Additional permissions should be obtained from the applicable author or publisher of the image. Full text @ Front Genet