FIGURE

Figure 3

ID
ZDB-FIG-200406-32
Publication
Westphal et al., 2020 - Chemical Genetics Screen Identifies Epigenetic Mechanisms Involved in Dopaminergic and Noradrenergic Neurogenesis in Zebrafish
Other Figures
All Figure Page
Back to All Figure Page
Figure 3

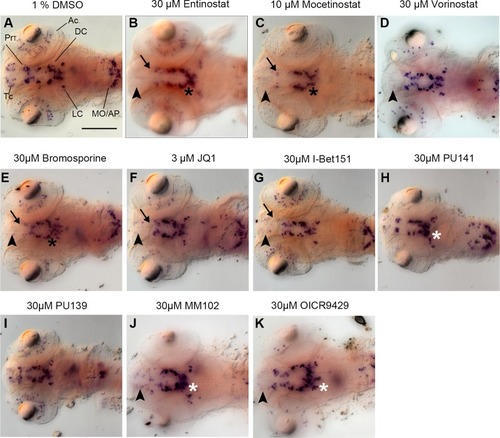
Primary Screen results for representative small molecule inhibitors. (A–K) Expression of the DA and NA neuronal marker th detected by whole mount in situ hybridization in embryos fixed after drug or control treatment at 96 hpf. Treatments are indicated above each panel. During the primary screen th expression was analyzed in DA clusters in telencephalon, pretectum, and diencephalic groups 1–6. Dorsal views of heads of larvae, images generated from Z-Projections of image stacks. Neuronal groups with reduced WISH stain are indicated as follows: Black arrowheads for telencephalic DA clusters (B–G, J, K), black arrows for pretectal DC clusters (B, C, E–G), black asterisks for DC DA clusters (B, C, E). White asterisks indicate increased stain intensities in DC DA clusters (H–K). Scale bar in (A) is 100 µm for all panels. AC, amacrine cells; Tc, telencephalon; PrT, pretectum; DC, diencephalic groups; Lc, locus coeruleus; MO/AP, medulla oblongata/area postrema.

Expression Data

Expression Detail
Antibody Labeling
Phenotype Data

Phenotype Detail
Acknowledgments
This image is the copyrighted work of the attributed author or publisher, and ZFIN has permission only to display this image to its users. Additional permissions should be obtained from the applicable author or publisher of the image. Full text @ Front Genet