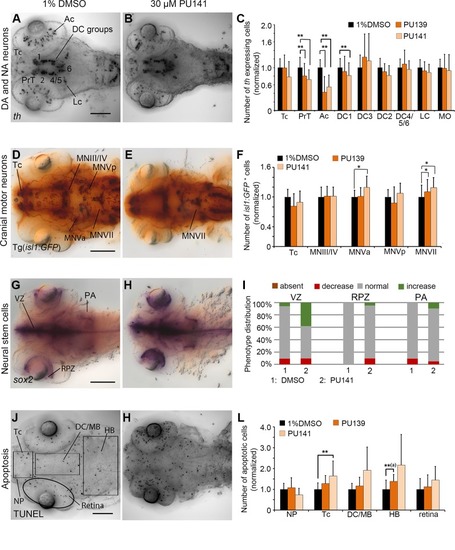
Quantification of Secondary Screen, HAT inhibitors. (A–C) Analysis of th expression (WISH) for DA and NA neuron development. (D–F) Immunohistochemistry for Isl1-GFP positive cranial motor neurons. (G–I) WISH analysis of sox2 expression in neural stem cells. (J–L) TUNEL assay to detect apoptotic cells. Embryos were treated with the HAT inhibitors PU139 or PU141 from 24 to 72 hpf and fixed at 96 hpf. (A, B, D, E, G, H, J, K) Dorsal views of heads of larvae, images generated from Z-Projections of image stacks, anterior at left. Scale bars represent 100 µm. Bar charts illustrate the mean cell count numbers of each neuronal subtype for (C) th expressing cells, (F)isl1:GFP transgene expressing cells, (L) apoptotic cells. Error bars depict standard deviations of the means. Asterisks indicate significant differences compared with the 1% DMSO control (p < 0.001). (I) For analysis of sox2 expression, embryos were classified into absent, decreased, normal or increased sox2 expression phenotypes (see color code) and embryo numbers were normalized to 100%. AC, amacrine cells; DA, dopaminergic; NA, noradrenergic; Tc, telencephalon; PrT, pretectum; DC, diencephalic groups; Lc, locus coeruleus; MO/AP, medulla oblongata/area postrema; MN, motor neuron cluster; VZ, ventricular zone; RPZ, retinal proliferation zone; PA, pharyngeal arches; NP, nasal placodes; DC/MB, diencephalon and midbrain region; HB, hindbrain.
|
