
- Title
-
Functional validation of novel MKS3/TMEM67 mutations in COACH syndrome
- Authors
- Lee, S.H., Nam, T.S., Li, W., Kim, J.H., Yoon, W., Choi, Y.D., Kim, K.H., Cai, H., Kim, M.J., Kim, C., Choy, H.E., Kim, N., Chay, K.O., Kim, M.K., Choi, S.Y.
- Source
- Full text @ Sci. Rep.
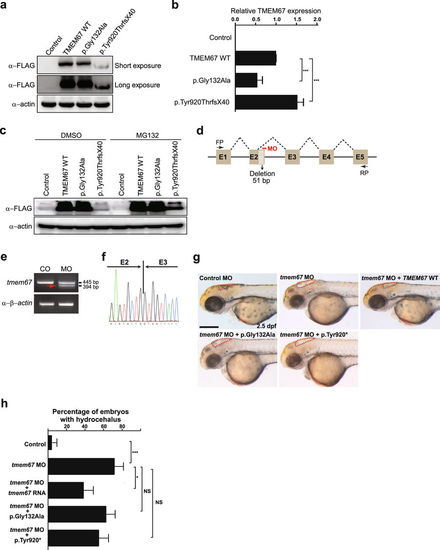
TMEM67 mutants show decrease in protein function. (a) HEK293T cells were transfected with plasmids individually encoding WT, p.Gly132Ala or p.Tyr920ThrfsX40 TMEM67, all fused C-terminally to a FLAG epitope, and processed for WB with anti-FLAG antibody. Anti-actin antibody was used for a loading control. Shown is a representative image of three independent experiments. Full-length blots are presented in Supplementary Fig. S1. (b) The transfected cells in (a) were processed for quantitative real-time PCR with TMEM67-specific primers. Expression levels of TMEM67 were normalized to those of ACTIN. ***P < 0.001 by the two-tailed Student’s t-test (n = 3). (c) The HEK293T cells transfected as described in (a) were treated with DMSO (dimethyl sulfoxide; vehicle control) or MG132 (25 μM) for 4 hr before harvest and processed for WB as described in (a). Cropped blots are presented. (d) A schema showing the binding site of tmem67 splice-blocking morpholino (MO [e2i2]). Dashed lines indicate splicing events. Not drawn to scale. E: exon; FP: forward primer; RP: reverse primer. (e) One-cell stage zebrafish embryos were injected with tmem67 MOs and processed for RT-PCR. β-actin was used as a loading control. Arrow indicates a PCR product with deletion of a part of exon2. (f) An electropherogram of an exon junction area of the PCR product indicated by arrow in (e). (g) One-cell stage zebrafish embryos were injected with either control MOs or tmem67 MOs [e2i2] and imaged at 2.5 days post-fertilization (dpf). For a rescue experiment, one-cell stage zebrafish embryos were sequentially injected with tmem67 MO [e2i2] and RNA encoding the indicated TMEM67 mutant and imaged at 2.5 dpf. Dashed lines mark the hindbrain ventricles. Arrows indicate enlarged ventricles (hydrocephalus). p.Tyr920* represents p.Tyr920ThrfsX40. Scale bar = 100 μm. (h) Embryos with hydrocephalus were counted in each group in (g). The hindbrain ventricles larger than 5,000 μm2 were considered to be hydrocephalic. *P < 0.05; ***P < 0.001 by the two-tailed Student’s t-test; NS: not significant. Number of larvae used in the analysis of each group is over 40. PHENOTYPE:
|
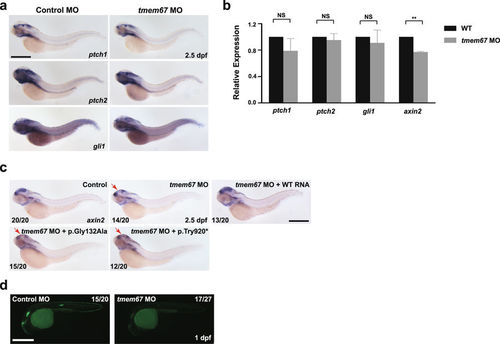
Wnt signaling, but not Hh signaling, is reduced in tmem67 morphants. (a) Zebrafish embryos were injected with either control or tmem67 MOs [e2i2], subjected to WISH at 2.5 dpf with ptch1, ptch2 and gli1 riboprobes, and imaged under a light microscope. NS: not significant. Scale bar = 200 μm. (b) Total RNAs were extracted from WT or tmem67 morphant embryos at 2.5 dpf and subjected to quantitative real-time PCR with ptch1, ptch2, gli1 and axin2 primers. Expression levels of indicated mRNA were normalized to those of actin primers. NS: not significant. ** P < 0.01. (c) One-cell stage zebrafish embryos were injected with either control or tmem67 MOs [e2i2], probed with axin2 riboprobes at 2.5 dpf and imaged. For a rescue experiment, one-cell stage zebrafish embryos were sequentially injected with tmem67 MO [e2i2] and RNA encoding the indicated TMEM67 mutant, probed with axin2 riboprobes at 2.5 dpf and imaged. p.Tyr920* represents p.Tyr920ThrfsX40. Arrows indicate reduction of signals compared to those in control embryos. Scale bar = 200 μm. (d) Tg(Tcf/Lef-miniP:dGFP) embryos were injected with either control or tmem67 MOs [e3i3] and imaged at 1 dpf under a fluorescent microscope. Scale bar = 200 μm. |
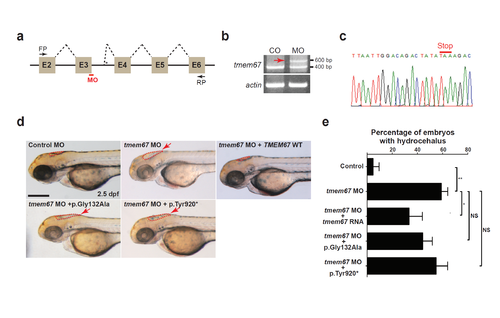
TMEM67 mutants show decrease in protein function. (a) A schema showing the binding site of tmem67 splice-blocking morpholino (MO [e3i3]). Dashed lines indicate splicing events. Not drawn to scale. E: exon; FP: forward primer; RP: reverse primer. (b) One-cell stage zebrafish embryos were injected with tmem67 MOs and processed for RT-PCR. Αctin was used as a loading control. Arrow indicates a PCR product with deletion of exon3 and retention of a part of intron3. (c) An electropherogram of an exon junction area of the PCR product indicated by arrow in (b). (d) One-cell stage zebrafish embryos were injected with either control MOs or tmem67 MOs [e3ie] and imaged at 2.5 days post-fertilization (dpf). For a rescue experiment, one-cell stage zebrafish embryos were sequentially injected with tmem67 MO [e3i3] and RNA encoding the indicated TMEM67 mutant and imaged at 2.5 dpf. Dashed lines mark the hindbrain ventricles. Arrows indicate enlarged ventricles (hydrocephalus). p.Tyr920* represents p.Tyr920ThrfsX40. Scale bar = 100 μm. (e) Embryos with hydrocephalus were counted in each group in (d). The hindbrain ventricles larger than 5,000 μm2 were considered to be hydrocephalic. *: P < 0.05; ***: P < 0.001 by the two-tailed Student’s t-test; NS: not significant. Number of larvae used in the analysis of each group is over 40. PHENOTYPE:
|