
- Title
-
Developmental Alterations in Heart Biomechanics and Skeletal Muscle Function in Desmin Mutants Suggest an Early Pathological Root for Desminopathies
- Authors
- Ramspacher, C., Steed, E., Boselli, F., Ferreira, R., Faggianelli, N., Roth, S., Spiegelhalter, C., Messaddeq, N., Trinh, L., Liebling, M., Chacko, N., Tessadori, F., Bakkers, J., Laporte, J., Hnia, K., Vermot, J.
- Source
- Full text @ Cell Rep.
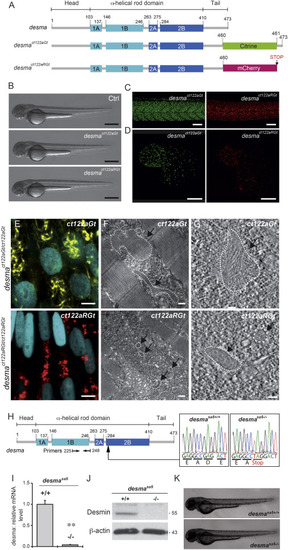
Desmin Flip Trap Fish Lines, desmact122aGt and desmact122aRGt, Enable Formation and Visualization of Desmin Aggregates while the desmasa5−/− Allele Leads to a Loss of desma Transcripts (A) Schematic drawing of the desma gene in WT, desmact122aGt or ct122aGt (with citrine fusion), and desmact122aRGt or Ct122aRGt (with mCherry fusion) fish lines. The ct122aRGt line presents a 13-amino-acid deletion at the end of the tail domain, and the ct122aGt line presents a full desma sequence containing the citrine fluorescent protein. (B) Side views of ct122aGt and ct122aRGt zebrafish embryos at 55 hpf. Scale bar, 500 μm. (C and D) Desmin aggregates are observed in skeletal muscles (scale bar, 100 μm) (C) and in the myocardium (scale bar, 50 μm) (D) in ct122aGt and ct122aRGt 48-hpf embryos. (E–G) Semicorrelative light and electron microscopy of skeletal muscles of ct122aGt and ct122aRGt 48-hpf embryos. (E) Confocal micrograph at high magnification of ct122aGt and ct122aRGt embryos. Nuclei are labeled with H2B-Cerulean. Scale bar, 5 μm. (F) Electron micrograph analyses of the same region showed cytosolic aggregates (the black arrows are pointing to the aggregates circled by the dotted lines) in ct122aGt and ct122aRGt embryos. Scale bar, 200 nm. (G) Electron tomography at high magnification showing filamentous aggregate structures in ct122aGt and compact aggregates with regular condensed structure in the ct122aRGt (the black arrows are pointing to the aggregates circled by the dotted lines). Scale bar, 100 nm. ct122aGt and ct122aRGt refers to homozygous embryos. (H) Scheme of the WT desma gene in zebrafish. Arrow indicates the position of the mutation in the desma gene sequence. Sequencing of genomic DNA from desmasa5+/+ and desmasa5−/− larvae reveals a G to T mutation resulting in a stop codon that leads to truncated Desma in desmasa5−/− mutants. (I) Reverse transcriptase qPCR on RNA extracted from pools of WT and desmasa5−/− mutants demonstrates defective amplification of the mutant transcripts of exons 3–4 demonstrating that the corresponding mRNA is degraded. The primers used for qPCR are highlighted in (A). (J) Immunoblot of 2 dpf WT and desmasa5−/− mutants demonstrating full knockdown of Desma protein. (K) Side views of zebrafish desmasa5+/+ and desmasa5−/− embryos at 55 hpf. Scale bar, 500 μm. The error bars correspond to the SEM. |
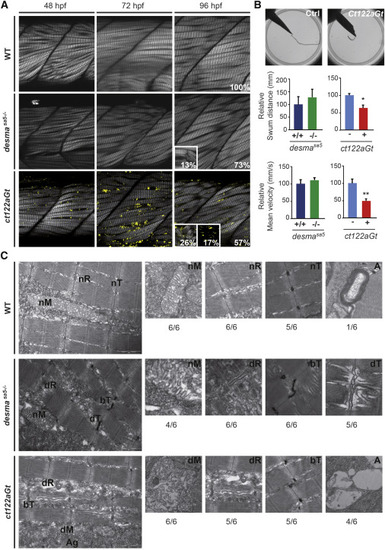
Aggravation of the Skeletal Muscle Phenotype Is Observed in desmact122aGt Embryos Compared to desmasa5−/− (A) Optical sections of the mid trunk region using SHG imaging show misalignment of muscle fibers in desmasa5−/− and desmact122aGt homozygous embryos compared to WT siblings at 48, 72, and 96 hpf. In ct122aGt mutants, muscle fiber misalignment is often accompanied by fiber breaks and degeneration from 48 hpf. At 96 hpf, phenotypes are separated in to three categories: weak (W) with misalignment only; strong (S) (see inset at 96 hpf for the desmact122aGt and desmasa5−/−) with misalignment accompanied with breaks, degenerations, and/or general decrease of the SHG intensity; and extreme (E) (see inset at 96 hpf for the desmact122aGt) where the SHG signal is absent because of the complete disorganization of sarcomeric structures. Scale bar, 20 μm. (B) Touch-evoke response assays show reduced swimming distance and velocity in ct122aGt embryos compared to controls, while the locomotion capacity of desmasa5−/− is similar to desmasa5+/+. (C) Electron micrograph of mitochondria (M), sarcoplasmic reticulum (R), T-Tubules (T), and autophagy structures (A) in controls, desmasa5−/−, and ct122aGt mutants. Note the sarcomeric reticulum dilatation (dR) T-tubule dilation (dT) and T-tubule bending (bT) in desmasa5−/− and the dilated mitochondria in the ct122aGt (dM), while these structures are normal in wild-type animals. The ratio indicates the respective frequencies (n = 6). ct122aGt indicates desmact122aGt homozygous embryos. Scale bar, 100 nm. The error bars correspond to the SEM. |
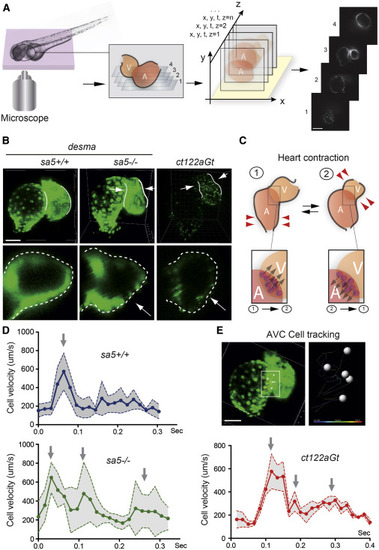
Heart Biomechanics Are Altered in the Absence of desma and in the Presence of Desmin Aggregates (A) 4D reconstructions of the heart-wall dynamics were obtained from 2D series recorded at a rate of 120 frames/s (fps) in successive planes. Periodic contractions were reconstructed in three dimensions using post acquisition synchronization of 48-hpf embryonic hearts. Scale bar, 30 μm. (B) Comparison of myocardial wall shape in desmasa5+/+, desmasa5−/−, and ct122aGt 4D reconstructed hearts shows a squeezing of the ventricle in both mutants ( Movies S2, S3, and S4). The lower panels show a zoom of an optical transverse section through the middle of the ventricle of desmasa5+/+, desmasa5−/−, and ct122aGt revealing the squeezing in absence of functional Desma (red arrows). Scale bar, 30 μm. (C) Schematic drawing recapitulating the myocardial movements associated with heart contraction and the subsequent movement of the atrioventricular canal (AVC). Examples of AVC cells tracks are shown in the lower panel. Their velocity was used as readout of the global contraction pattern of the heart. Scale bar, 30 μm. (D) Graph representing the velocity of myocardial cell motion in the AVC region following 3D cell tracking in desmasa5+/+, desmasa5−/−, and ct122aGt. (E) Individual nuclei were tracked automatically and their speed was extracted. ct122aGt indicates desmact122aGt homozygous embryos. The error bars correspond to the SEM. |

Ca2+ Propagation in the Beating Heart Is Deficient in the Absence of Functional Desmin (A) Snapshots from videos corresponding to the 4D reconstructions of a single heartbeat in Tg(myl7:GalFF; UAS:Gcamp3.0) WT, desmasa5−/−, and ct122aRGt 48-hpf embryos ( Movies S5, S6, and S7) show perturbations in the Ca2+ signal at the ventricle tip in the absence of functional Desma. Scale bar, 30 μm. (B) Ca2+ intensity plots and quantification of the amplitude of the Ca2+ peak upon contraction in four different regions of the heart: (1) inflow tract; (2) atrium outer curvature; (3) ventricle proximal outer curvature; and (4) ventricle distal outer curvature. The amplitude is significantly reduced in region 3 of the desmasa5−/− and in regions 3 and 4 of the ct122aRGt (n = 5 embryos, n ≥ 10 cells for each condition). Plots correspond to a representative example of each condition. Note that the heart-contraction sequences for each condition are not starting at the same moment of the contraction cycle. Gray arrows indicate the direction of blood flow through the heart. ct122aRGt indicates desmact122aRGt homozygous embryos. The error bars correspond to the SEM. |
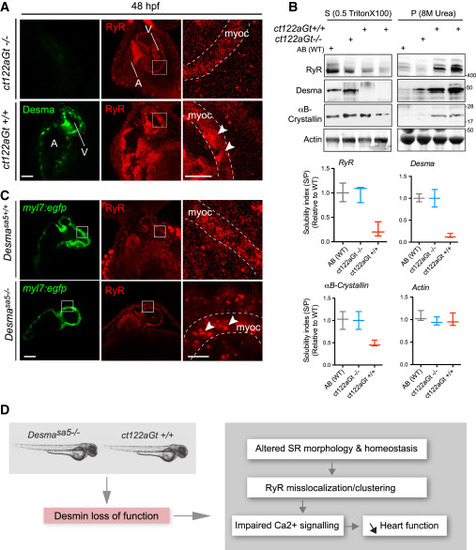
Desma Aggregation or Loss of Function Impact on Ryanodine Receptor Localization (A) Confocal images of RyR (red) in cardiac muscle from 48-hpf embryos showed homogenous and regular labeling mostly in the myocardium (myoc, highlighted with the white dotted lines) in control fish (ct122aRGt−/−), while in desma ct122aRGt+/+ mutant hearts RyR display irregular localization and clustering (white arrowheads). Scale bar, 30 μm.(B) In support of (A), RyR solubility was reduced in ct122aRGt+/+ mutant fish extracts compared to control where the majority of RyR fraction remains in the Triton X-100 fractions. αΒ-crystallin solubility is also affected in ct122aRGt+/+ embryos. Actin is the loading control. Bars showed quantification from two independent experiments, and each sample contains a mixture of 50–100 fish. (C) Similar to (A), confocal images of cardiac muscle from 48-hpf embryos in desmasa5−/− animals crossed with the myocardium-specific Tg(myl7:egfp) (green) line compared to controls (Tg(myl7:egfp; desmasa5+/+)) showing mislocalization and clustering (white arrowheads) of RyR in the myocardium (myoc, highlighted with the white dotted lines). Scale bar, 30 μm. myoc, myocardium (D) Schematic drawing of how desma loss of function (knockout or aggregation) could impact sarcoplasmic reticulum shape and EC-coupling machinery particularly on RyR localization. The error bars correspond to the SEM. EXPRESSION / LABELING:
|

Reduction of Desma Level Ameliorates Skeletal and Cardiac Muscle Phenotypes Observed in desmact122aGt Homozygous Embryos (A) Classification of the skeletal muscle phenotypes obtained with SHG. Normal phenotype is attributed to embryos with similar muscle shape as the controls. Weak phenotype corresponds to the situation where muscle fibers are misaligned or present abnormal curvatures. A strong phenotype is attributed when embryonic muscle display degenerated and/or broken fibers, a global decrease in the size of the musculature or a global decrease in the intensity of the SHG signal. A phenotype is called extreme when the muscle disorganization is such that no SHG signal is observed anymore. Scale bar, 30 μm. (B) Evaluation of phenotypes in ct122aGt injected with the 33 and 100 μM MO, uninjected, and WT embryos from 48 to 96 hpf. The assessment of a phenotype is based on the scale presented in (A) after SHG imaging. (C) Size and number of aggregates in ct122aGt injected with two different concentrations of MO (33 and 100 μM). Embryos injected with 100 μM present a high reduction in aggregate numbers, while 33 μM of MO did not reduce the aggregate number. (D) Images of aggregates and corresponding SHG in ct122aGt embryos treated with 10- and 66-nM concentrations of MO or the corresponding control (Ctr). Scale bar, 30 μm. (E and F) Two additional concentration of MO showed a dose-dependent reduction in size and number of aggregates. (G) All the tested concentration were employed to monitor desmin solubility index = Triton X-100 soluble desmin (S)/insoluble or pellet (P) in whole zebrafish extracts. Actin is the loading control. (H) Decreased desma level by MO treatment improves fish mobility but does not impact speed. (I) MO-mediated desma knockdown restore normal cardiac fractional shortening in ct122aGt line. ct122aGt indicates desmact122aGt homozygous embryos. The error bars correspond to the SEM. |
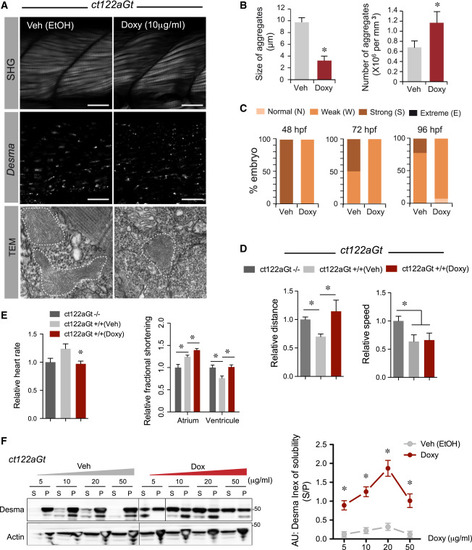
Pharmacological Targeting of Desma Aggregates Rescue ct122aGt Phenotype (A) Confocal and electron microscopy images showing the impact of Doxycycline (Doxy) treatment on ct122aGt muscle. Doxy-treated embryos showed more condensed and smaller aggregates compared to the controls. Scale bar, 20 μm (SHG). Scale bar, 100 nm (TEM) (B) Quantification of aggregate size and number in Doxy-treated embryos compared to the corresponding vehicle-treated embryos. (C) Evaluation of the phenotypes of Doxy and vehicle-treated embryos using SHG and the scale defined in (C) show that only weak and normal phenotypes were observed after Doxy treatment, while strong phenotypes are present in the controls. Note that the vehicle contains ethanol, which is leading to a stronger phenotype than in the non-vehicle-treated ct122aGt line. (D) Touch-evoke response assays showing that Doxy treatment improves swimming distance but not speed in ct122aGt. (E) Doxy-treated ct122aGt showed increased fractional shortening (FS) in the atrium but could re-establish FS in the ventricle. (F) Doxy treatment increases desma solubility (index of solubility) in dose-dependent manner. Actin is the loading control. ct122aRGt indicates desmact122aRGt homozygous embryos. The error bars correspond to the SEM. |
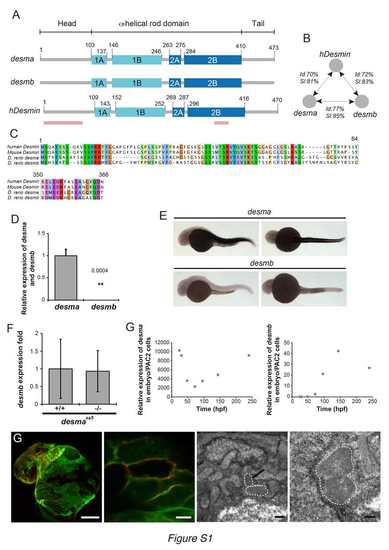
desma is the main ortholog of desmin in zebrafish and Myocardial Desma aggregates present membrane localization (related to Fig.1). (A) Scheme showing the structural homology between zebrafish desma, desmb and human desmin. Pink lines show the position, where the alignments were not complete and are presented in C. (B) Scheme showing results of identity (Id) and similarity (SI) calculated by alignment of desma, desmb and human desmin (hdesmin). Alignment and calculations were performed on ClustalW2. (C) Protein sequence alignments of regions of lower similarity between mouse, human desmin and zebrafish desmin a (zdesma) and desmin b (zdesmb). (D) qPCR of desma and desmb on RNA extracted from pools of WT 48hpf embryos shows a 2500 fold enrichment in desma compared to desmb. (E) In situ hybridization confirms the low expression of desmb compared to the clear desma signal observed in all muscle cell types of 30hpf zebrafish embryos (skeletal muscle and myocardium, no smooth muscle present at this stage). Scale bar=300μm. (F) qPCR on RNA extracted from pools of WT and desmasa5-/- shows that desmb expression is not altered in desmaSa5-/-. (G) qPCR on RNA made from pools of WT zebrafish larvae from 30hpf to 14dpf show the evolution of desma and desmb expression over time. Expression levels are given relative to the expression in PAC2 zebrafish cells. Desma expression is high at early stages and decreases around 50 hours to increase again linearly from 50 to 250 hpf. Desmb expression is very low until 96 hpf and then peaks at 150 hpf but without reaching levels comparable to desma enrichment. (G) Z-stack maximal projection of confocal images of ct122aRGt; Tg(myl7:ras-eGFP)s883 and electron micrograph in ct122aRGt myocardium in 48hpf embryos. Tg(myl7:ras-eGFP)s883 marks the cardiomyocyte membrane and colocalizes with the mCherry-positive aggregates. Upper left panel: Scale bar=50μm. Upper right panel: Scale bar = 5μm. Lower left panel: Scale bar = 0.5μm. Lower right panel: Scale bar = 200nm. Black arrow shows the position of an aggregate observed in a cardiomyocyte. ct122aRGt indicates desmact122aRGt homozygous embryos. (D, F) Error bars indicate the standard deviation. |
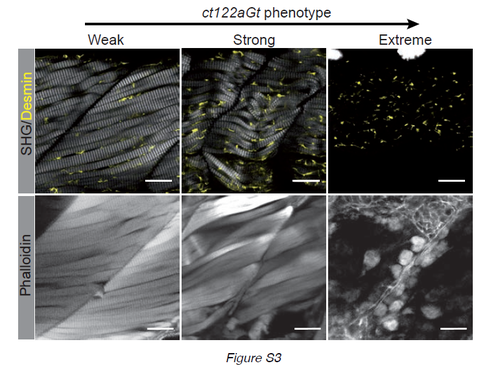
Correlation of SHG phenotype and phalloidin labeling in ct122aGt+/+ lines (related to Fig.2). Gradual phenotype of ct122aGt+/+ monitored by SHG and phalloidin on tail muscle. As for SHG phalloidin staining disappear gradually from weak to extreme phenotype. Scale bar =20μm. |
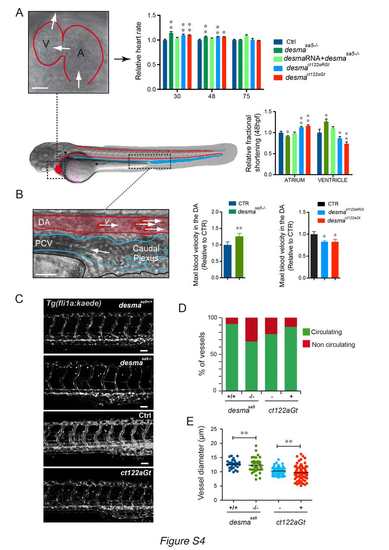
Cardiac parameters and vasculature defects are observed in desmaSa5-/-, desmact122aGt homozygous embryos and desmact122aRGt homozygous embryos. ct122aRGt indicates desmact122aRGt homozygous embryos (related to Fig.3). Side view of a zebrafish embryo highlighting the embryonic circulatory network, where the heart and the dorsal aorta (DA) are underlined in red and the venous vessels (posterior cardinal vein, PCV) in blue. (A) Measurements of cardiac parameters in desmasa5-/-, ct122aGt, ct122aRGt and control embryos including heart rate and fractional shortening analysis. The fractional shortening (FS%) is calculated as the ratio of the difference between diastolic and systolic chamber diameter over the diastolic diameter. Scale bar=30μm. (B) Zoom on the DA and PCV showing the flowing red blood cells, which were tracked to measure the blood flow velocity. The graph shows the relative maximal blood flow velocity measured in the DA of the trunk as readout of the pumping efficiency in desmasa5-/- and in ct122aGt embryos compared to their relative controls. Scale bar=20μm. (C) Z-stack maximal projections showing the organization of the intersegmental vessels (ISVs) in desmasa5+/+, desmasa5-/-; ct122aGt positive and control Tg(fli:gal4FFubs; UAS:kaede) embryos at 50hpf. Scale bar =20μm. (D) Percentage of circulating versus non-circulating vessels desmasa5-/-, ct122aGt and ct122aRGt embryos compared to control embryos. (E) Measurements of ISV diameters show a higher variability in desmasa5-/- and ct122aGt compared to their corresponding controls. ct122aGt and ct122aRGt indicate desmact122aGt and desmact122aRGt homozygous embryos. Error bars indicate the standard deviation. |
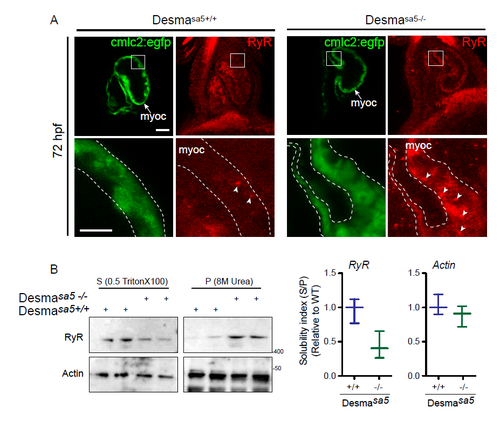
Ryanodine Receptor (RyR) localization is affected in desmasa5+/+ heart (related to Fig.5). (A) RyR localization in desmasa5-/- animals crossed with the myocardium specific Tg(myl7:egfp) (green, myoc, highlighted with the white dotted lines) line compared to controls Tg(myl7:egfp;desmasa5+/+) at 72 hpf. RyR was homogenously distributed (with few small clusters, white arrowheads) in the myocardium in control heart (desmasa5-/-) while it showed important clustering and heterogeneous distribution in the desmasa5+/+ hearts (white arrowheads). Scale bar=30μm, 15μm in the zoom. (B) Confirmation of RyR miss localization in whole fish homogenates by western blot where the major part of RyR protein remains in the X-100 Triton insoluble fraction (Pellet, P) from desmasa5+/+ while RyR is mostly enriched in the X-100 Triton soluble fraction in control samples (desmasa5-/- homogenates). Histograms showing the solubility index (S/P) from 2 independent experiments where actin is the loading control and each homogenate contains a mixture of 80-100 fish. Error bars indicate the standard deviation. |
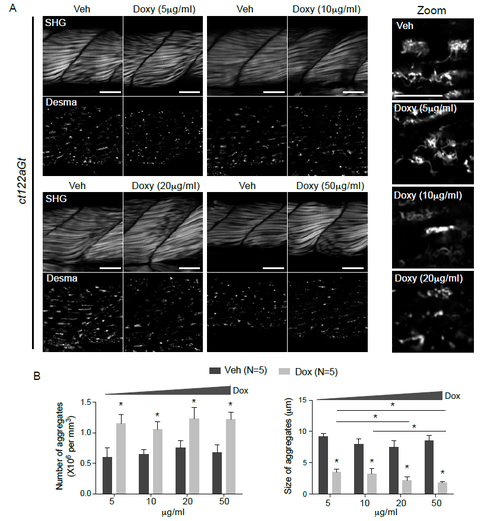
Dose-dependent effect of Doxy treatment on muscle architecture and aggregate shape in ct122aGt+/+ lines (related to Fig.6). (A) SHG images and desma aggregates following increased dose of Doxy in ct122aGt+/+ lines showed obvious improvement of skeletal muscle organization when ct122aGt+/+ fishes were treated with 5, 10 and 20 mg/ml doxy. The higher concentration seems less efficient may be due to the drug toxicity at this concentration. Scale bar=20μM. Zoom on the desmin aggregates following Doxy treatment at 5, 10 and 20 mg/ml. (B) Quantification of number and size of desma aggregates in skeletal muscle fowling Doxy treatment. Note that Doxy-treatment increased the number of aggregates with decreased size demonstrating a potential action of this drug in aggregate dissociation/fragmentation. 10 fishes at least were analyzed for each condition and aggregates number and size were counted on a pre-fixed area of the tail. Error bars indicate the standard deviation. |