
Fig. S4
- ID
- ZDB-FIG-170320-11
- Publication
- Ramspacher et al., 2015 - Developmental Alterations in Heart Biomechanics and Skeletal Muscle Function in Desmin Mutants Suggest an Early Pathological Root for Desminopathies
- Other Figures
- All Figure Page
- Back to All Figure Page
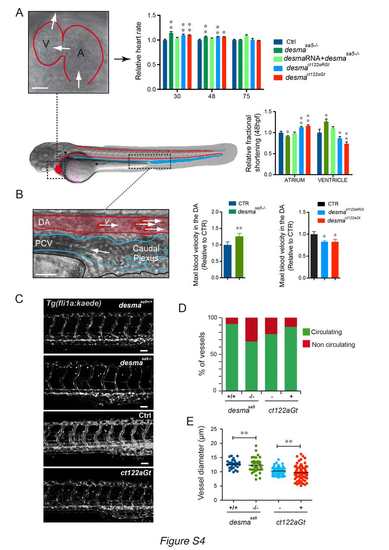
Cardiac parameters and vasculature defects are observed in desmaSa5-/-, desmact122aGt homozygous embryos and desmact122aRGt homozygous embryos. ct122aRGt indicates desmact122aRGt homozygous embryos (related to Fig.3). Side view of a zebrafish embryo highlighting the embryonic circulatory network, where the heart and the dorsal aorta (DA) are underlined in red and the venous vessels (posterior cardinal vein, PCV) in blue. (A) Measurements of cardiac parameters in desmasa5-/-, ct122aGt, ct122aRGt and control embryos including heart rate and fractional shortening analysis. The fractional shortening (FS%) is calculated as the ratio of the difference between diastolic and systolic chamber diameter over the diastolic diameter. Scale bar=30μm. (B) Zoom on the DA and PCV showing the flowing red blood cells, which were tracked to measure the blood flow velocity. The graph shows the relative maximal blood flow velocity measured in the DA of the trunk as readout of the pumping efficiency in desmasa5-/- and in ct122aGt embryos compared to their relative controls. Scale bar=20μm. (C) Z-stack maximal projections showing the organization of the intersegmental vessels (ISVs) in desmasa5+/+, desmasa5-/-; ct122aGt positive and control Tg(fli:gal4FFubs; UAS:kaede) embryos at 50hpf. Scale bar =20μm. (D) Percentage of circulating versus non-circulating vessels desmasa5-/-, ct122aGt and ct122aRGt embryos compared to control embryos. (E) Measurements of ISV diameters show a higher variability in desmasa5-/- and ct122aGt compared to their corresponding controls. ct122aGt and ct122aRGt indicate desmact122aGt and desmact122aRGt homozygous embryos. Error bars indicate the standard deviation. |