
|
Fig. 2
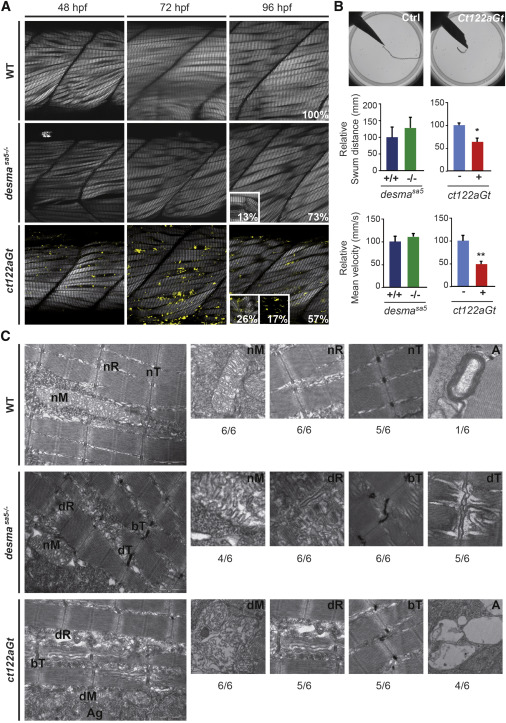
Aggravation of the Skeletal Muscle Phenotype Is Observed in desmact122aGt Embryos Compared to desmasa5−/−
(A) Optical sections of the mid trunk region using SHG imaging show misalignment of muscle fibers in desmasa5−/− and desmact122aGt homozygous embryos compared to WT siblings at 48, 72, and 96 hpf. In ct122aGt mutants, muscle fiber misalignment is often accompanied by fiber breaks and degeneration from 48 hpf. At 96 hpf, phenotypes are separated in to three categories: weak (W) with misalignment only; strong (S) (see inset at 96 hpf for the desmact122aGt and desmasa5−/−) with misalignment accompanied with breaks, degenerations, and/or general decrease of the SHG intensity; and extreme (E) (see inset at 96 hpf for the desmact122aGt) where the SHG signal is absent because of the complete disorganization of sarcomeric structures. Scale bar, 20 μm.
(B) Touch-evoke response assays show reduced swimming distance and velocity in ct122aGt embryos compared to controls, while the locomotion capacity of desmasa5−/− is similar to desmasa5+/+.
(C) Electron micrograph of mitochondria (M), sarcoplasmic reticulum (R), T-Tubules (T), and autophagy structures (A) in controls, desmasa5−/−, and ct122aGt mutants. Note the sarcomeric reticulum dilatation (dR) T-tubule dilation (dT) and T-tubule bending (bT) in desmasa5−/− and the dilated mitochondria in the ct122aGt (dM), while these structures are normal in wild-type animals. The ratio indicates the respective frequencies (n = 6). ct122aGt indicates desmact122aGt homozygous embryos. Scale bar, 100 nm.
The error bars correspond to the SEM.