
Image
|
Figure Caption
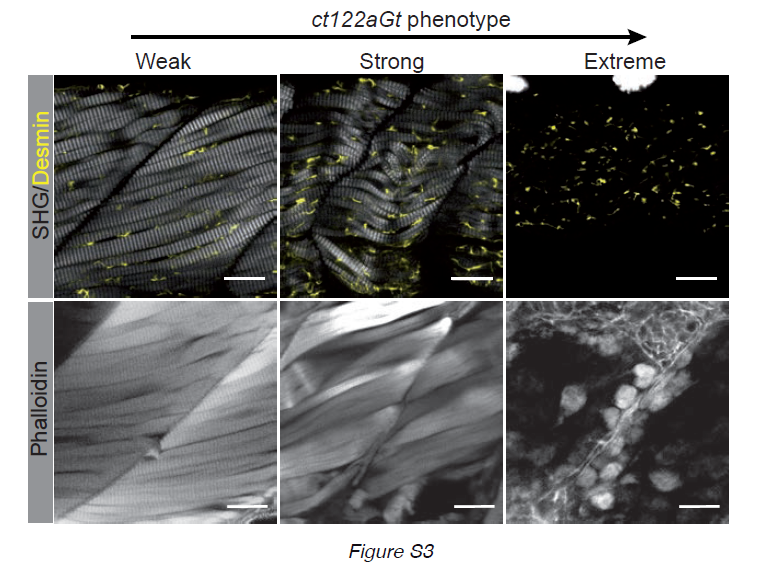
Fig. S3
Correlation of SHG phenotype and phalloidin labeling in ct122aGt+/+ lines (related to Fig.2). Gradual phenotype of ct122aGt+/+ monitored by SHG and phalloidin on tail muscle. As for SHG phalloidin staining disappear gradually from weak to extreme phenotype. Scale bar =20μm.
Acknowledgments
This image is the copyrighted work of the attributed author or publisher, and
ZFIN has permission only to display this image to its users.
Additional permissions should be obtained from the applicable author or publisher of the image.
Full text @ Cell Rep.