
- Title
-
A novel model of demyelination and remyelination in a GFP-transgenic zebrafish
- Authors
- Fang, Y., Lei, X., Li, X., Chen, Y., Xu, F., Feng, X., Wei, S., Li, Y.
- Source
- Full text @ Biol. Open
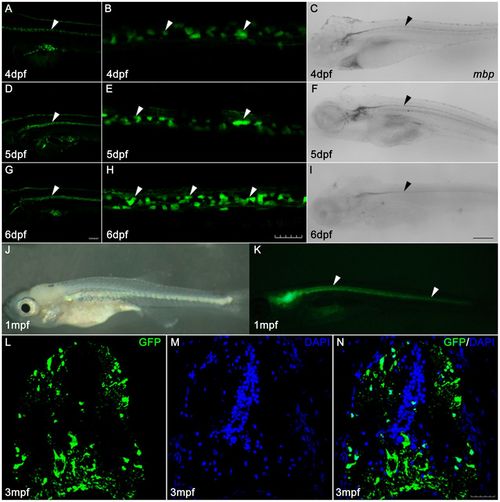
The EGFP of Tg(mbp:nfsB-egfp) is specifically expressed in oligodendrocytes along the spinal cord. Panels A,D,G are images of EGFP expression in larvae at 4, 5 and 6?dpf, respectively. Panels B,E,H are high magnification images of EGFP expression in spinal cords in panels A,D,G, respectively. Note that the distribution of EGFP signals continued linearly along the spinal cord (white arrowheads). Panels C,F,I show the expression of mbp mRNA by whole mount in situ hybridization in larvae at 4, 5 and 6?dpf, respectively. Note that the mbp-expressing cells are localized along the spinal cord (black arrowheads). Panels J,K are images of bright field (J) and fluorescence (K) of Tg(mbp:nfsB-egfp) at 1?mpf. EGFP continues to strongly express along the spinal cord (white arrowheads in K). Panels L?N illustrate GFP staining on sections taken from the transverse spinal cord of the 3-month-old (3?mpf) adult Tg(mbp:nfsB-egfp). Note that the GFP-positive cells are mainly located in dorsolateral and ventral spinal cord. Dorsal is up and rostral is left in Panels A?K. Dorsal is up in Panels L?N. Scale bar: A,D,G, 100?�m; B,E,H,L?N, 30?�m; C,F,I, 200 �m. |
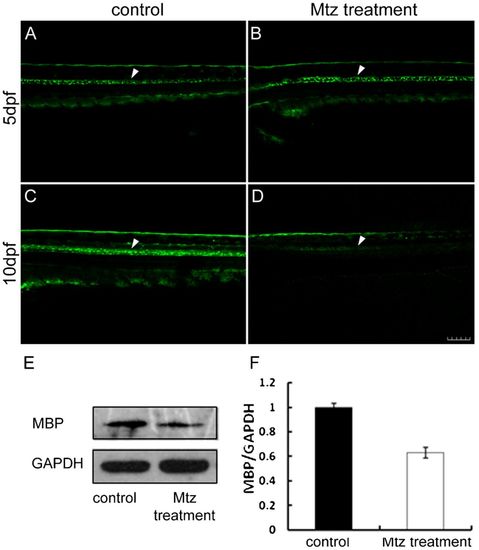
Mtz treatment specifically depletes oligodendrocytes of Tg(mbp:nfsB-egfp). Panels A,B demonstrate that EGFP is expressed in larvae from the 5?dpf control group and Mtz treatment group before Mtz treatment (white arrowheads), respectively. In control larva, EGFP was strongly expressed (C, white arrowhead) at 10?dpf. Panel D shows the EGFP expression in larva from the Mtz treatment group at 10?dpf after an exposure to 5?mM Mtz for 5 days. Note that the fluorescence signals were significantly reduced along the spinal cord (white arrowhead). Panel E is the result of a western blot with the MBP antibody at 5?dpf and 10?dpf. Note that the MBP protein expression was significantly suppressed in the Mtz treatment larvae at 10?dpf (F). Dorsal is up and rostral is left in Panels A?D. Scale bar: 100 �m. |

ZFIN is incorporating published figure images and captions as part of an ongoing project. Figures from some publications have not yet been curated, or are not available for display because of copyright restrictions. PHENOTYPE:
|
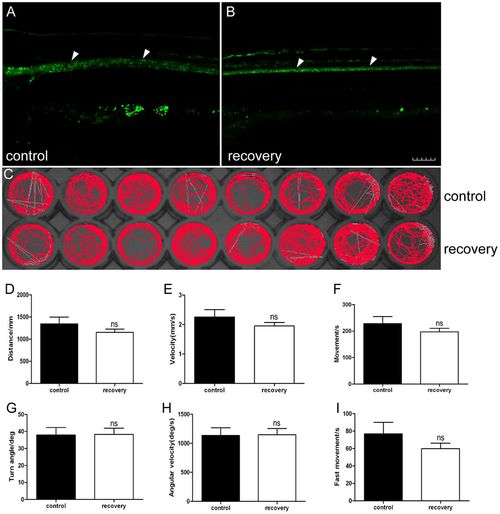
Reappearance of EGFP expression in Tg(mbp:nfsB-egfp) larvae results in the recovery of locomotor capacity. Panel A shows the expression of EGFP (white arrowheads) in larva from the control group at 17?dpf. Panel B shows that the expression of EGFP appeared again after a 7-day Mtz withdrawal in larva from the Mtz treatment group. Note that the positive signals are along the spinal cord (white arrowheads), which has a same expression pattern as control (A). Panel C is the digital tracks in larvae from the control group and recovery group at 17?dpf. Panels D?I show the statistical analysis on the average of total movement distance (D), velocity (E), total movement time (F), turn angle (G), angular velocity (H) and fast movement time (I) between groups. Note that there is no significant difference between the recovery group and control group (t-test, P>0.05). Dorsal is up and rostral is left in A,B. Scale bar: 100 �m. |