
|
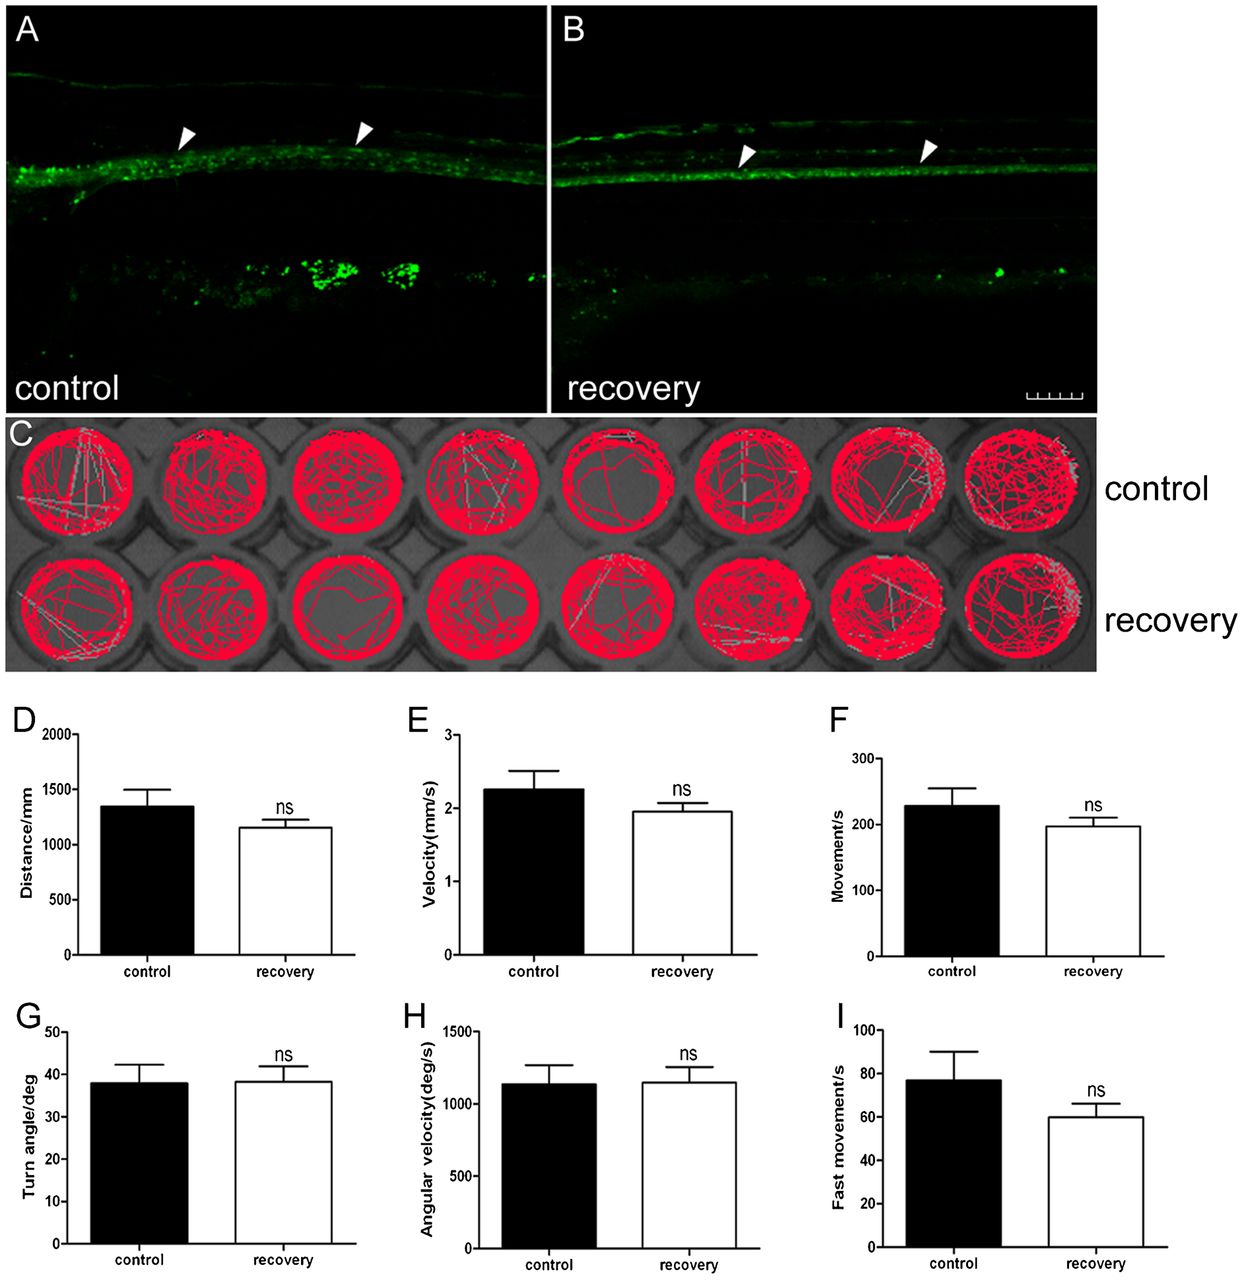
Fig. 4
Reappearance of EGFP expression in Tg(mbp:nfsB-egfp) larvae results in the recovery of locomotor capacity.
Panel A shows the expression of EGFP (white arrowheads) in larva from the control group at 17 dpf. Panel B shows that the expression of EGFP appeared again after a 7-day Mtz withdrawal in larva from the Mtz treatment group. Note that the positive signals are along the spinal cord (white arrowheads), which has a same expression pattern as control (A). Panel C is the digital tracks in larvae from the control group and recovery group at 17 dpf. Panels D–I show the statistical analysis on the average of total movement distance (D), velocity (E), total movement time (F), turn angle (G), angular velocity (H) and fast movement time (I) between groups. Note that there is no significant difference between the recovery group and control group (t-test, P>0.05). Dorsal is up and rostral is left in A,B. Scale bar: 100 µm.