
|
Fig. 2
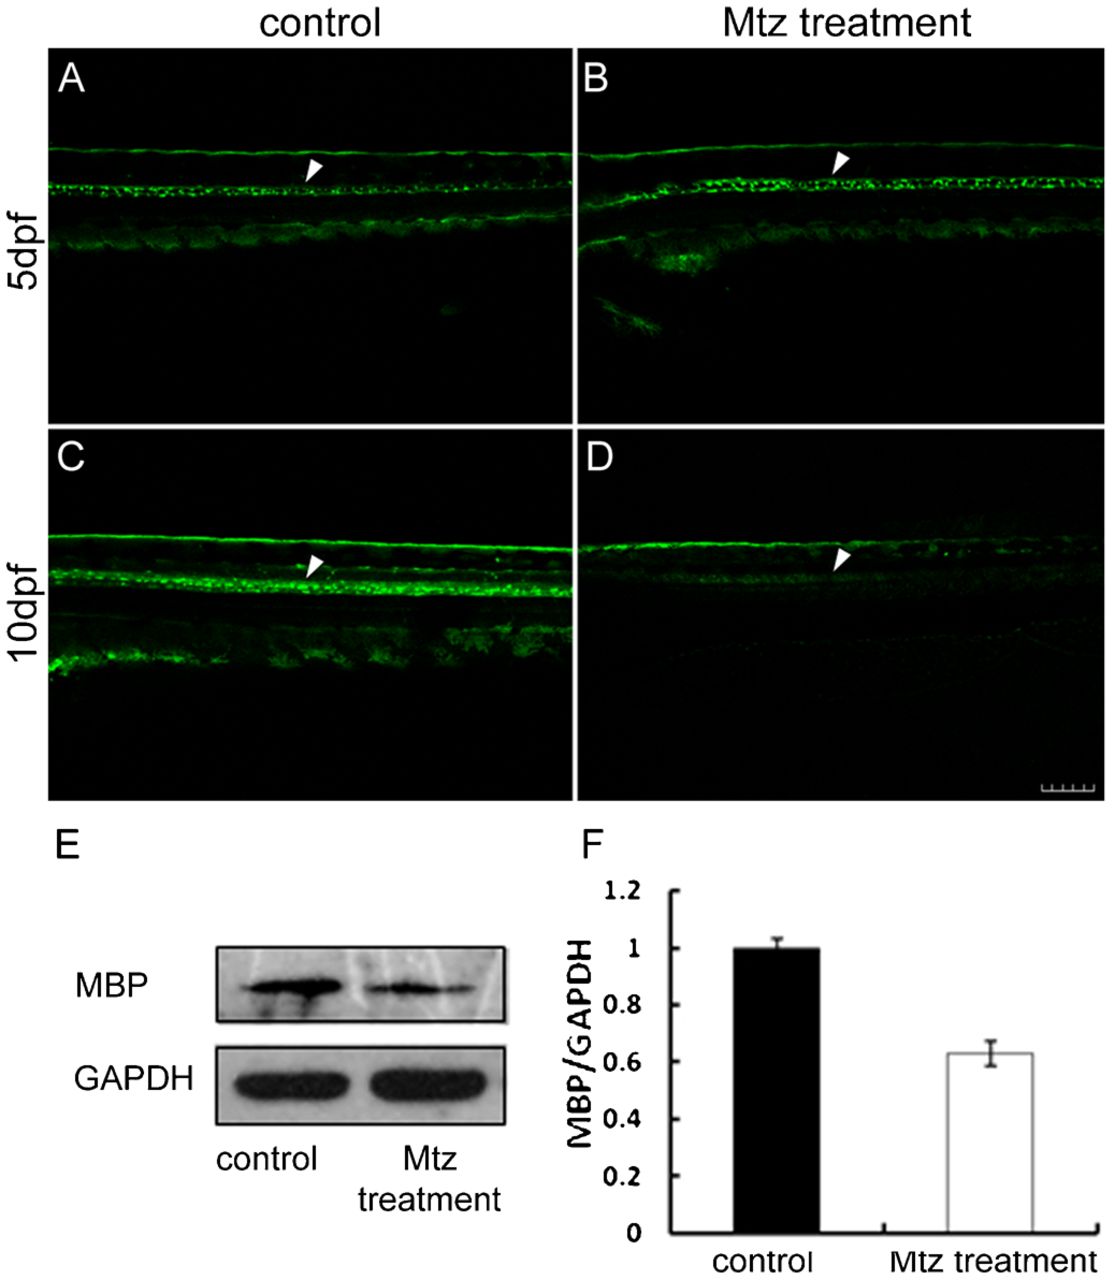
Mtz treatment specifically depletes oligodendrocytes of Tg(mbp:nfsB-egfp).
Panels A,B demonstrate that EGFP is expressed in larvae from the 5 dpf control group and Mtz treatment group before Mtz treatment (white arrowheads), respectively. In control larva, EGFP was strongly expressed (C, white arrowhead) at 10 dpf. Panel D shows the EGFP expression in larva from the Mtz treatment group at 10 dpf after an exposure to 5 mM Mtz for 5 days. Note that the fluorescence signals were significantly reduced along the spinal cord (white arrowhead). Panel E is the result of a western blot with the MBP antibody at 5 dpf and 10 dpf. Note that the MBP protein expression was significantly suppressed in the Mtz treatment larvae at 10 dpf (F). Dorsal is up and rostral is left in Panels A–D. Scale bar: 100 µm.