
Fig. 1
- ID
- ZDB-FIG-171011-7
- Publication
- Fang et al., 2014 - A novel model of demyelination and remyelination in a GFP-transgenic zebrafish
- Other Figures
- All Figure Page
- Back to All Figure Page
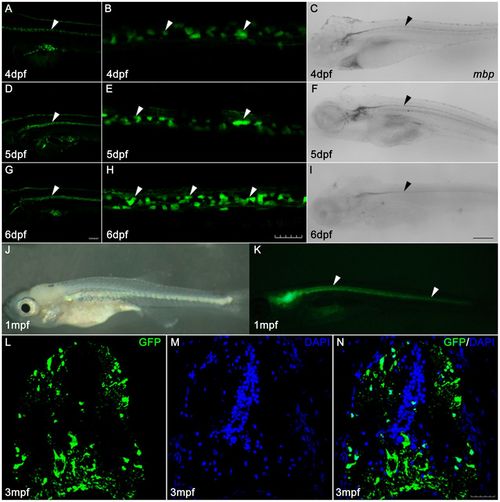
The EGFP of Tg(mbp:nfsB-egfp) is specifically expressed in oligodendrocytes along the spinal cord. Panels A,D,G are images of EGFP expression in larvae at 4, 5 and 6 dpf, respectively. Panels B,E,H are high magnification images of EGFP expression in spinal cords in panels A,D,G, respectively. Note that the distribution of EGFP signals continued linearly along the spinal cord (white arrowheads). Panels C,F,I show the expression of mbp mRNA by whole mount in situ hybridization in larvae at 4, 5 and 6 dpf, respectively. Note that the mbp-expressing cells are localized along the spinal cord (black arrowheads). Panels J,K are images of bright field (J) and fluorescence (K) of Tg(mbp:nfsB-egfp) at 1 mpf. EGFP continues to strongly express along the spinal cord (white arrowheads in K). Panels L–N illustrate GFP staining on sections taken from the transverse spinal cord of the 3-month-old (3 mpf) adult Tg(mbp:nfsB-egfp). Note that the GFP-positive cells are mainly located in dorsolateral and ventral spinal cord. Dorsal is up and rostral is left in Panels A–K. Dorsal is up in Panels L–N. Scale bar: A,D,G, 100 µm; B,E,H,L–N, 30 µm; C,F,I, 200 µm. |
| Genes: | |
|---|---|
| Antibody: | |
| Fish: | |
| Anatomical Terms: | |
| Stage Range: | Day 4 to Adult |