
- Title
-
The tumor suppressor gene retinoblastoma-1 is required for retinotectal development and visual function in zebrafish
- Authors
- Gyda, M., Wolman, M., Lorent, K., and Granato, M.
- Source
- Full text @ PLoS Genet.
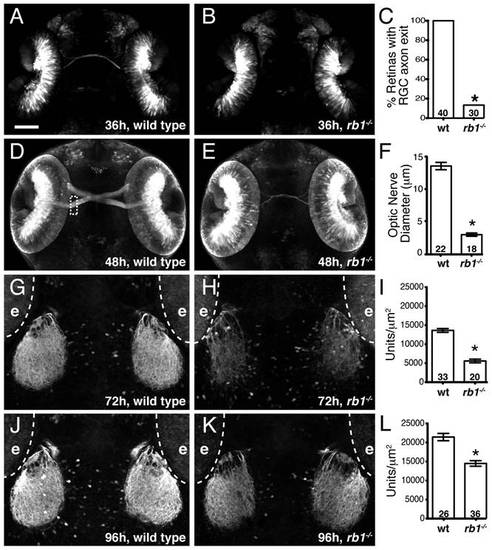
Rb1-deficient embryos possess delayed retinotectal projection. Dorsal view of maximum intensity projection of confocal z-stacks of RGC axons in wild type or rb1te226; ath5:gfp+/- embryos. (A–C) RGC axons fail to exit rb1te226 retina at 36 hpf. (D–F) rb1te226 optic nerves are hypoplastic. Diameter measured upon retinal exit, marked by dashed rectangle. (G-L) Tectal innervation is reduced in rb1te226 at 72 (G-I) and 96 hpf (J–L). Innervation measured as a function of pixel intensity units per µm2 from summation intensity projections of tectal area (not shown, see Experimental Procedures). Digitally excluded eyes (e) are outlined by dotted line. (C, F, I, L) Bar graphs represent the mean with error bars denoting SEM. *p<0.001; one-way ANOVA (F, I, L) or binomial z-test (C). N retinas, optic nerves, or tecta shown at base of bar graphs. Anterior to the top of panel, scale bar = 50 μm. |
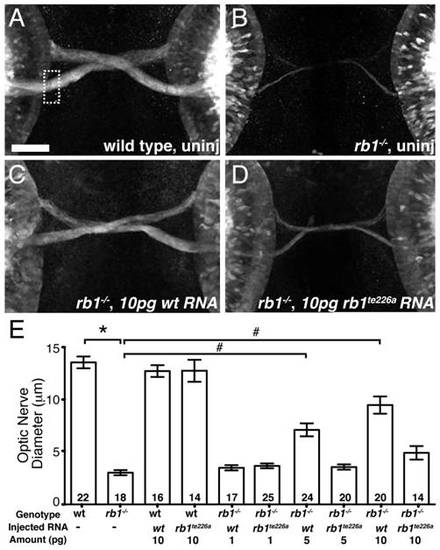
rb1 mRNA overexpression rescues optic nerve hypoplasia in rb1te226 mutants. (A-B) Optic nerves of uninjected wild type (A) and rb1te226a; ath5:gfp+/- embryos (B) at 48 hpf. (C-D) Optic nerves of rb1te226a; ath5:gfp+/- embryos injected with 10 pg of wild type rb1 (C) or rb1te226a (D) mRNA. Dorsal view of maximum intensity projection of confocal z-stacks. (E) Mean optic nerve diameter, measured at dashed rectangle in (A). Error bars denote SEM. *p<0.001, #p<0.01; one-way ANOVA with brackets indicating compared groups. N optic nerves shown at base of bar graphs. Anterior to the top of panel, scale bar = 50 μm. |

rb1 is required in RGC axons to regulate retinal exit. (A-B) rb1 expression by RT-PCR from the 1-cell to 120 hpf larval stage and in the retina by in situ hybridization at 32 hpf. B-actin shown as control. White dashed circle marks lens position. (C) Schematic representation of retinal exit by ath5:gfp labeled transplanted RGC clones. (D-F) Transplanted ath5:gfp labeled clones from wild type donors to rb1te226 mutant retinas (D) and vice versa (E–F). White dashed oval marks retinal exit point. Arrow indicates intraretinally misrouted axons (E). Scale bar = 50 μm. |
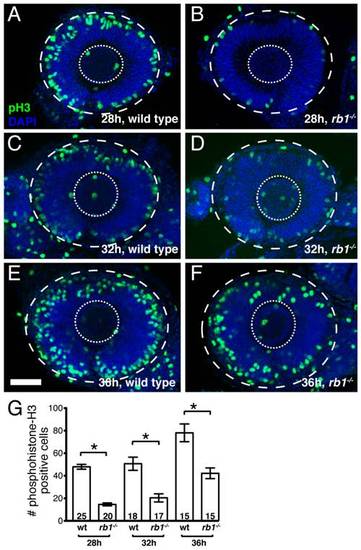
rb1te226a retinas show delayed cell cycle exit during early retinogenesis. Retinas removed from wild type (A, C, E) or rb1te226a embryos (B, D, F) at 28 (A-B), 32 (C-D), or 36 hpf (E-F). Retinas labeled with anti-phosphohistone H3 antibody (green) to label M-phase nuclei and counterstained with DAPI (blue). Lateral view of maximum intensity projection of confocal z-stacks. Inner dashed circle outlines lens and outer dashed circle outlines retina. (G) Mean number of anti-phosphohistone-H3 labeled cells per retina. Error bars denote SEM. *p<0.01; one-way ANOVA with brackets indicating compared groups. N retinas shown at base of bar graphs. Anterior to the left, dorsal to the top of each panel. Scale bar = 50 μm. |

rb1te226a retinas possess fewer postmitotic RGCs. Retinas removed from wild type (A, C, E) or rb1te226a; isl2b:gfp embryos (B, D, F) at 32 (A-B), 36 (C-D), or 48 hpf (E-F). Retinas labeled with anti-GFP (green) to label postmitotic, isl2b expressing RGCs and counterstained with DAPI (blue). Lateral view of maximum intensity projection of confocal z-stacks. White circle outlines retina. Anterior to the left, dorsal to the top of each panel. Scale bar = 50 μm. |
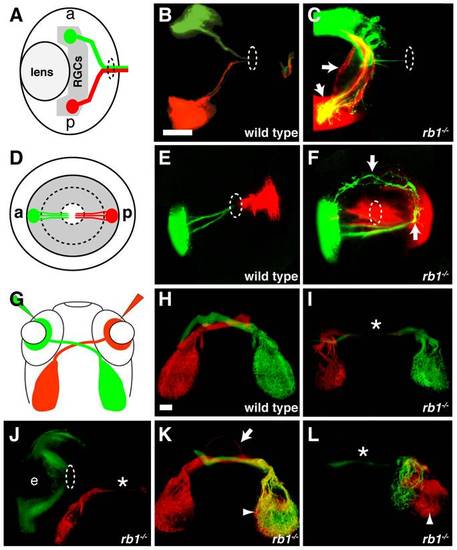
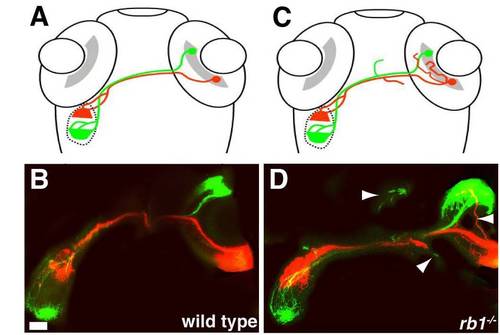
Intraretinal and midline RGC axon pathfinding errors in rb1te226a mutants. (A-C) Dorsal, intraretinal views of DiO (green) labeled anterior and DiI (red) labeled posterior RGCs. (D-F) Lateral, intraretinal views of DiO/DiI labeled RGCs. (G-L) Dorsal views of retinotectal projection labeled by whole retina fills with DiI/DiO. Eyes removed in H-I, K-L. Dashed circles indicate retinal exit point. Arrows mark misprojecting axons. Asterisk shows optic nerve hypoplasia. Arrowheads mark ipsilateral tectal innervation. Abbreviations: (a) anterior, (p) posterior, (e) eye. Scale bar = 50 μm. PHENOTYPE:
|
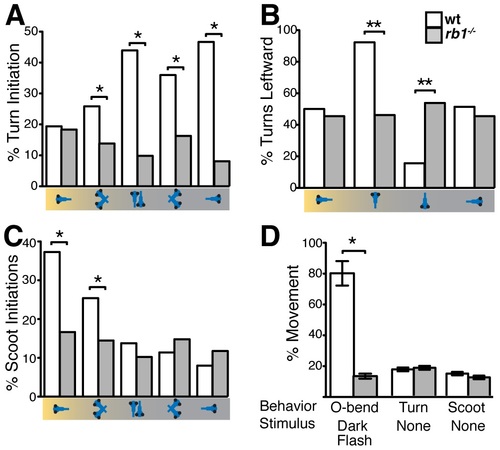
rb1te226a larvae fail to execute visually guided behaviors. (A) Mean frequency of turns initiated for the first 5 sec of positive phototaxis for subsets of larvae in the schematized orientations with respect to target light (on left). (B) Mean percentage of turns in a leftward direction: 50% represents no directional bias. (C) Mean frequency of scoot swims for the first 5 sec of positive phototaxis for subsets of larvae in the schematized orientations. (D) Mean O-bend response to visual dark flash stimuli and mean initiation of spontaneous turn and scoot swim initiation. Error bars denote SEM. N larvae for each experiment described in Experimental Procedures. *p<0.001, **p<0.01, Wilcoxon-signed rank test. #p<0.001, one-way ANOVA. PHENOTYPE:
|

rb1te226a retinas show increased apoptosis. Retinas removed from wild type (A, C, E) or rb1te226a; ath5:gfp embryos (B, D, F) at 28 (A–B), 32 (C–D), or 36 hpf (E–F). Retinas labeled anti-GFP (green), TUNEL (red), and counterstained with DAPI (blue). Lateral view of maximum intensity projection of confocal z-stacks. White dashed circle outlines retina. Anterior to the left, dorsal to the top of each panel. (G) Mean number of TUNEL positive nuclei per retina. Error bars denote SEM. *p<0.01; one-way ANOVA. N retinas shown at base of bar graphs. Scale bar = 50 μm. |
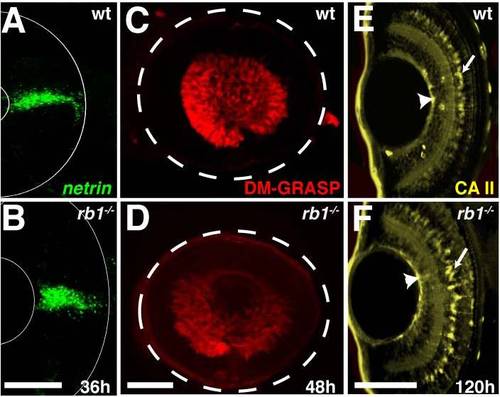
rb1te226a retinas express markers indicating normal gross morphology. Retinas removed from wild type (A, C, E) or rb1te226a embryos (B, D, F) at 36 (A–B), 48 (C–D), or 120 hpf (E–F). (A,B) netrin in situ shows presence of glial cells at optic stalk of retina. (C, D) DM-GRASP immunolabeling labels postmitotic, differentiated RGCs. White dashed circle outlines retina. (E, F) Carbonic anhydrase II (CA II) immunolabeling identifies Muller glia cell bodies (arrows) and endfeet (arrowheads). Lateral views of maximum intensity projection of confocal z-stacks. Anterior to the left, dorsal to the top of each panel. Scale bar = 50 μm. |
Retinotopic mapping is intact in rb1te226a tectum. Dorsal views of schematized (A, C) and confocal projections (B, D) of retinotectal projection in wild type (A, B) and rb1te226a larvae at 120 hpf. DiO (green) labeled axons from anterior RGCs innervate the caudal tectum, while DiI (red) labeled axons of posterior RGCs project to the rostral tectum in both wild type and rb1te226a larvae. Arrowheads mark misprojecting axons. Scale bar = 50 μm. PHENOTYPE:
|

ZFIN is incorporating published figure images and captions as part of an ongoing project. Figures from some publications have not yet been curated, or are not available for display because of copyright restrictions. PHENOTYPE:
|