
|
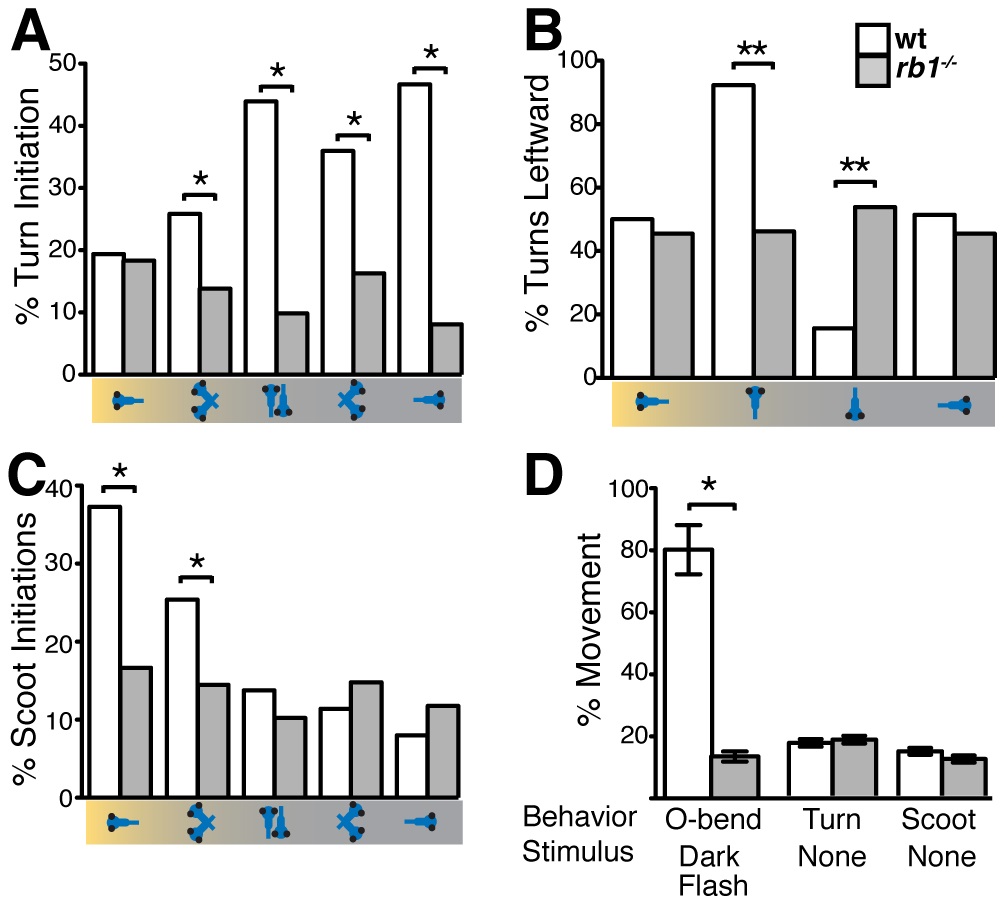
Fig. 8
rb1te226a larvae fail to execute visually guided behaviors.
(A) Mean frequency of turns initiated for the first 5 sec of positive phototaxis for subsets of larvae in the schematized orientations with respect to target light (on left). (B) Mean percentage of turns in a leftward direction: 50% represents no directional bias. (C) Mean frequency of scoot swims for the first 5 sec of positive phototaxis for subsets of larvae in the schematized orientations. (D) Mean O-bend response to visual dark flash stimuli and mean initiation of spontaneous turn and scoot swim initiation. Error bars denote SEM. N larvae for each experiment described in Experimental Procedures. *p<0.001, **p<0.01, Wilcoxon-signed rank test. #p<0.001, one-way ANOVA.